 MedVision: Benchmarking Quantitative Medical Image Analysis
🚀 Releases
- Release MedVision dataset v1.4.0 T/L regeneration5 release-v1.4.0
- Release MedVision dataset v1.3.0 new dataset release-v1.3.0
- Release MedVision dataset v1.2.1 bugfix4 release-v1.2.1
- Release MedVision dataset v1.2.0 new datasets withdrawn: MAMA-MIA & PI-CAI3 release-v1.2.0
- Release MedVision dataset v1.1.1 bugfix2 release-v1.1.1
- Release MedVision dataset v1.1.0 new filter bug: sagittal/coronal T/L1 release-v1.1.0
- Release MedVision dataset v1.0.0 bug: sagittal/coronal T/L1 first release
- For T/L tasks, use axial slices only — the error in T/L annotations on sagittal and coronal slices is resolved in
v1.1.1. - Fixed a T/L annotation error in anisotropic slices (only sagittal and coronal slices).
- Missing image reorientation to RAS+: annotations were recorded in the orientation the source shipped, while the loader reoriented the images to RAS+ at loading stage. Withdrawn in
v1.2.1. - Reissues the MAMA-MIA & PI-CAI annotations in RAS+. If you have ever loaded either, clear the cache once — the release note has the snippet.
- Regenerates the T/L annotations of all 12 tumor/lesion datasets: a millimetre size floor replaces the pixel-count floor, growing published landmarks from 75.8K to 3.8M (50×). Train/test membership changes for six datasets (those with
v1.1.1annotations: autoPET-III, BraTS24, HNTSMRG24, KiPA22, KiTS23, and MSD) — do not compare av1.4.0test metric against an earlier one there. Read the blog.
🗂️ Images & Annotations
MedVision consolidates 31 public medical imaging datasets into one uniformly structured resource. The imaging spans five modalities — X-ray (XR), CT, MRI, ultrasound (US) and PET — across many anatomical regions.
Upon release v1.4.0, it consists of 33.2K 3D images and 12.0M annotated 2D
slices, carrying 25.7M single-instance annotations and 50.5M multi-instance annotations.
Source images are stored as 3D volumes reoriented to RAS+ (the canonical right-anterior-superior axis convention), which keeps plane definitions consistent even when the original datasets use different orientations. MedVision does not distribute pre-cut PNG slices. Instead, the loader returns the 3D image path, the 2D slice metadata (slice dimension, slice index, label index, and more), and its annotations. Keeping the original volumes preserves header metadata, such as pixel spacing and the affine matrix, needed to calculate measurements in physical units, the information PNGs cannot retain.
Segmentation masks. Every dataset except Ceph-Biometrics-400 — landmark-only — ships with segmentation masks: dense manual ground truth drawn by expert annotators, and the source of the label names shown in each task’s label map below. To download the image and mask files, load any of a dataset’s detection configs. MedVision distributes only the annotations, and the loader fetches and preprocesses the raw imaging into the dataset folder you specify.
Read more in the documentation: 📚 what MedVision holds · 📚 the four annotation types · 📚 multi-instance vs single-instance annotations
Pre-rendered QC figures — the landmark / ellipse ground truth drawn on each sampled slice, not what the model receives as input.
📊 Dataset Statistics
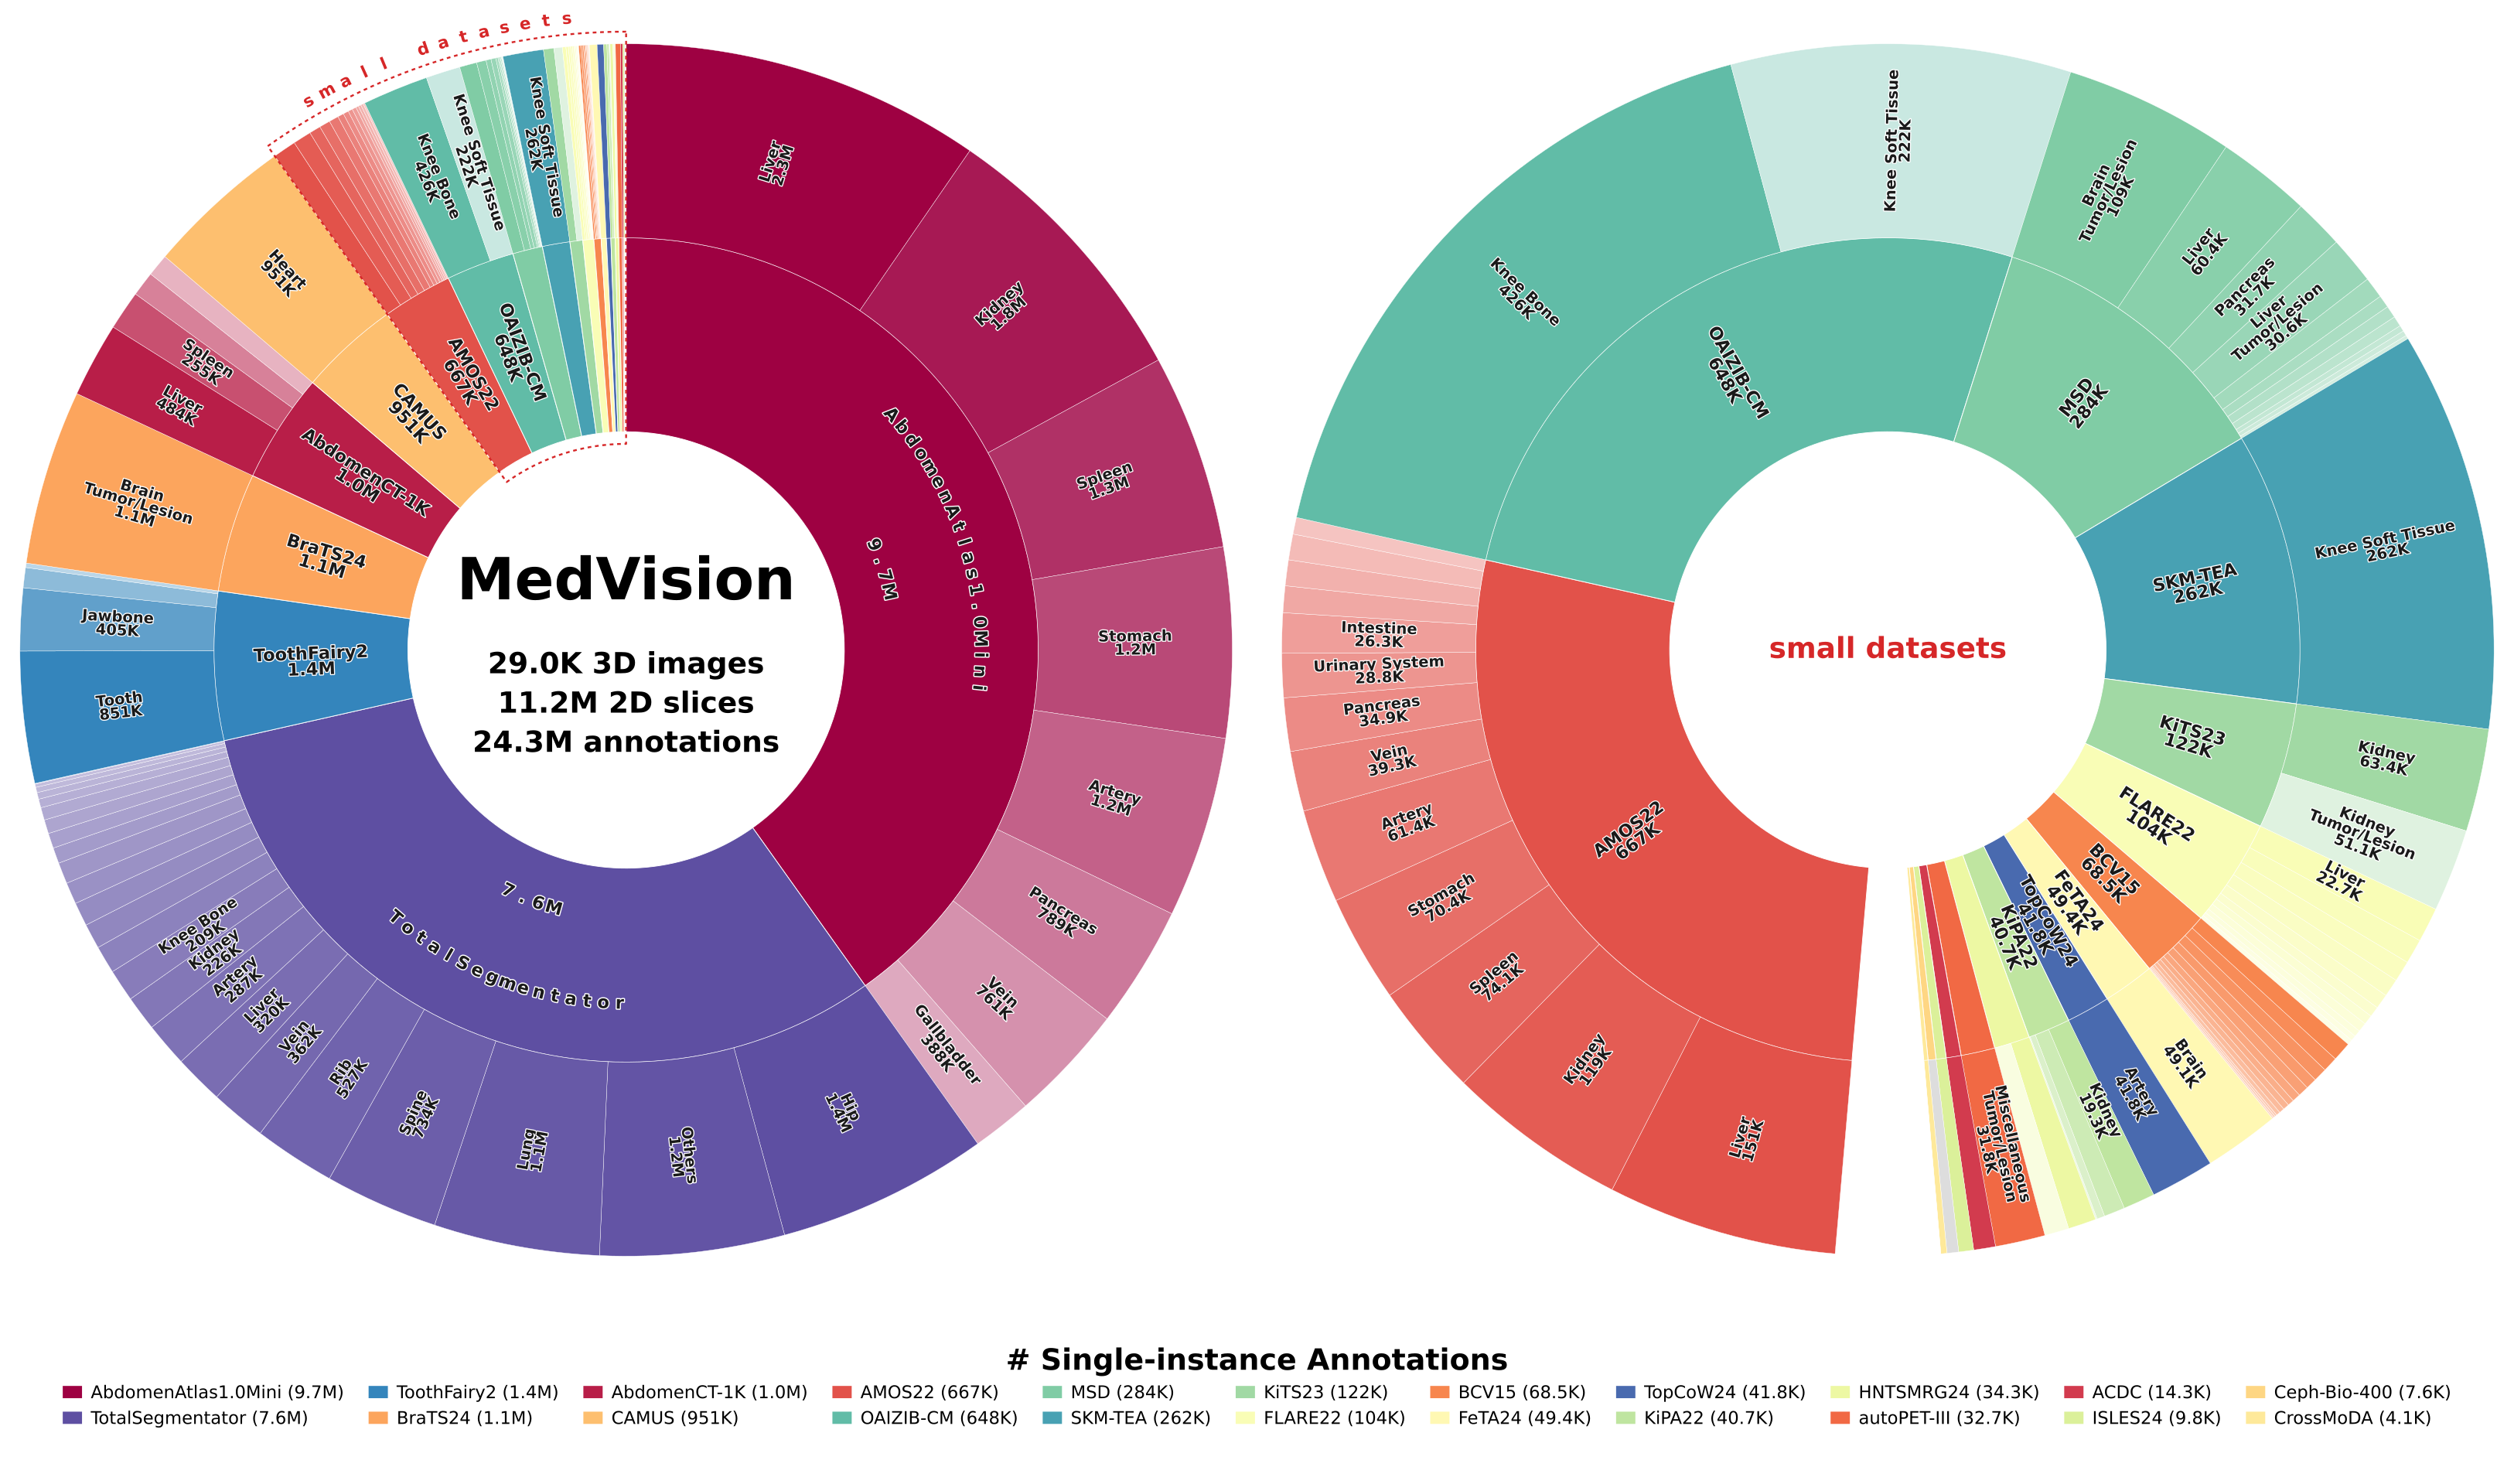
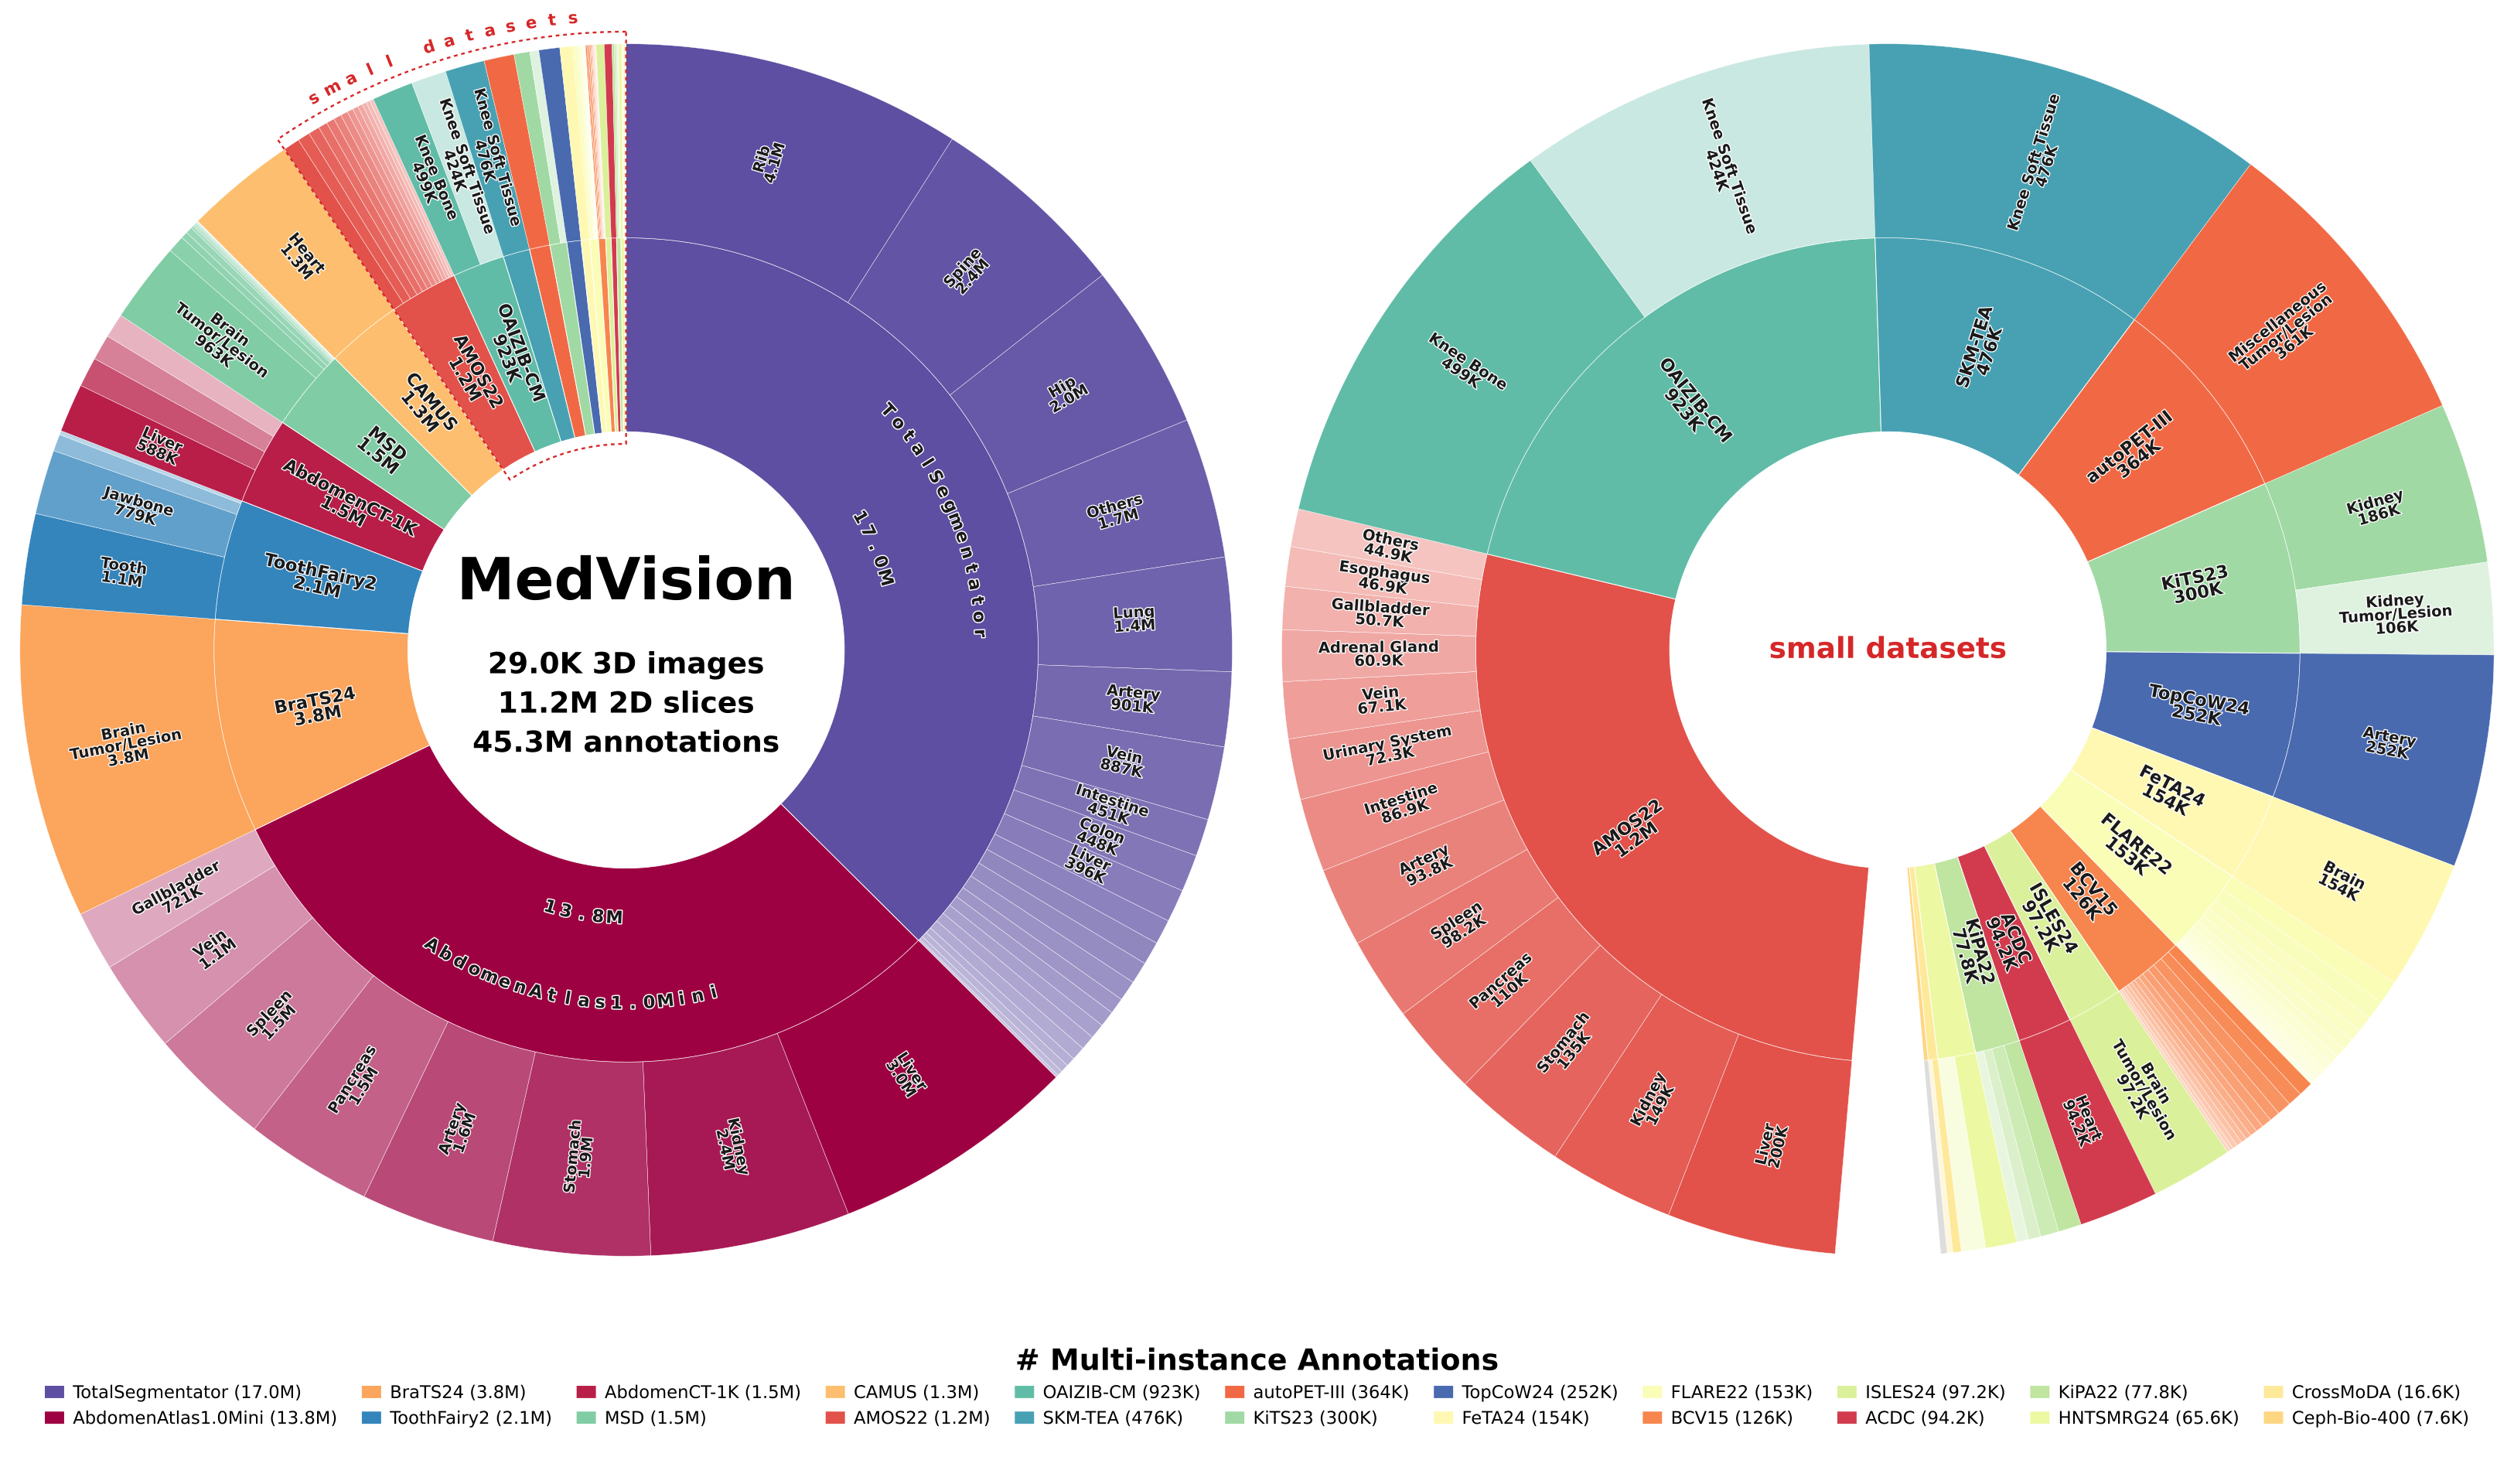
Annotation counts per dataset for the 31 datasets released through annotation v1.4.0, across the three quantitative tasks — detection (Box),
tumor/lesion size (T/L), and angle/distance (A/D). The two sets
differ only by filtering: single-instance keeps a target only when it is a single, large-enough instance, while
multi-instance keeps every annotated target whatever its instance count or size.
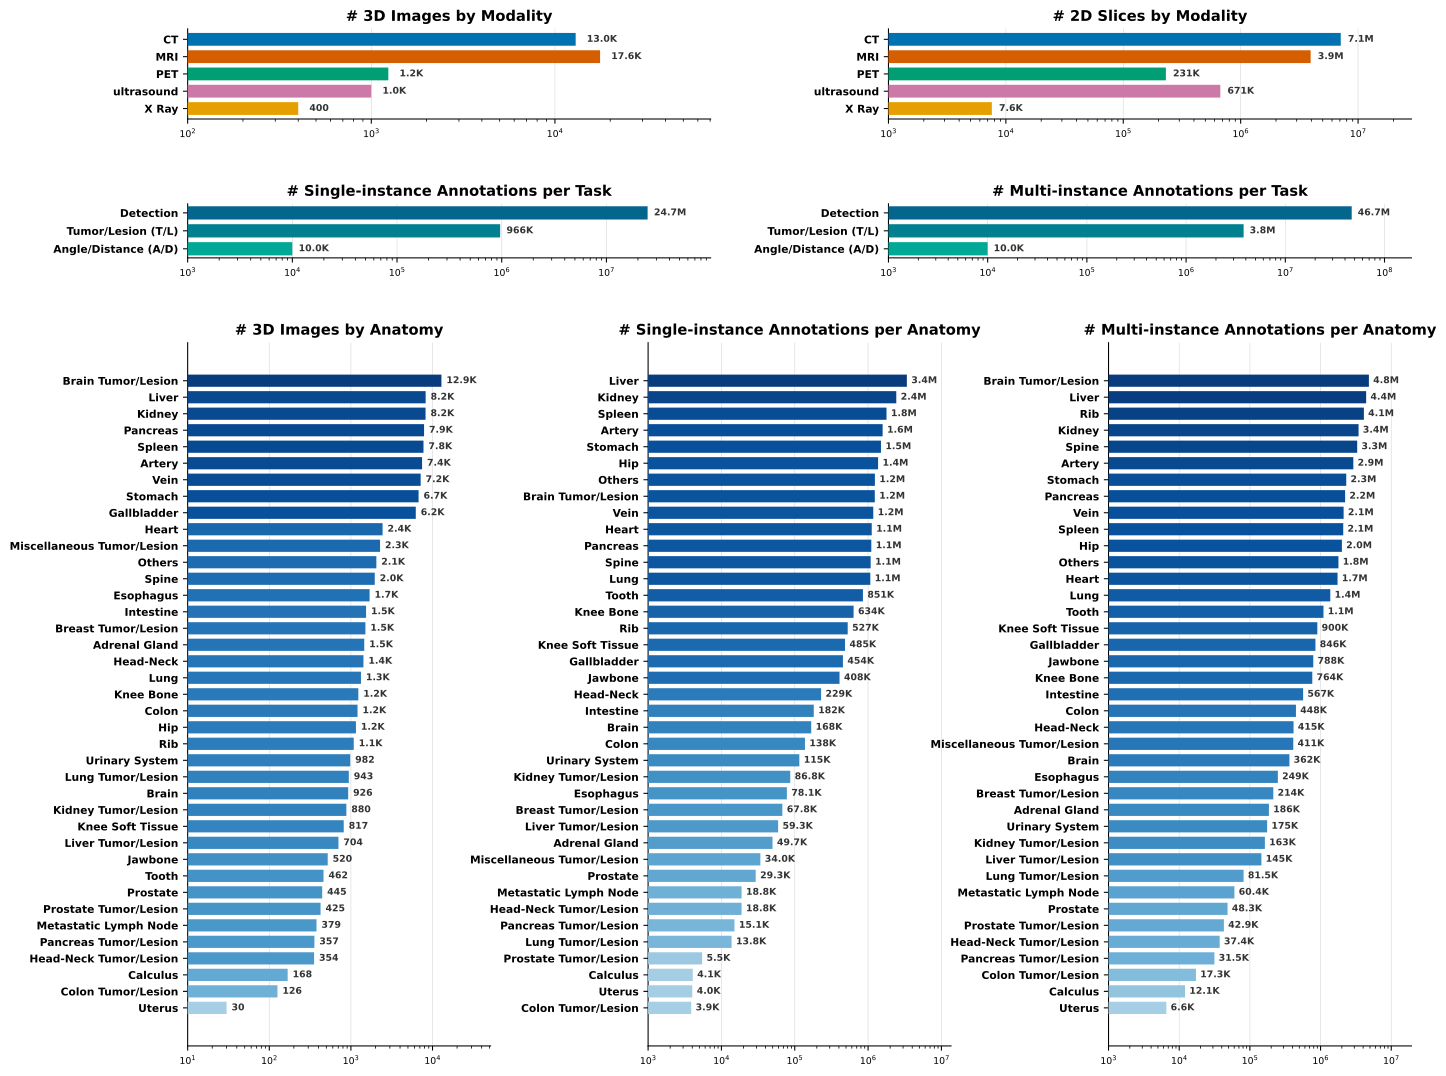
The same collection viewed by imaging modality and anatomy rather than by dataset. The top row counts 3D volumes and 2D slices per modality; the bottom row counts volumes and both annotation views per anatomy group.
Two things to read carefully. The slice counts are summed over all three planes, so one volume contributes three times. And the anatomy panels do not partition the collection: a volume counts once in every anatomy group it contains, so a whole-abdomen CT adds to liver, kidney and spleen alike, and the bars deliberately sum to more than the unique-image total.
🩻 Dataset Preview
What MedVision covers, before you filter it. Every body part on the left connects to the anatomy labels it contains on the right — labels come from each dataset’s segmentation masks and landmark sets, so this is the vocabulary the explorer below searches over.
It reads both ways. Pick a dataset from the panel on top to light up the body parts and anatomy labels it annotates — or point at any row to light up the datasets that carry it.
🔎 Dataset Explorer
Install the loader dependency first:
pip install datasets==3.6.0
Narrow the MedVision data to the subset you need, then copy the exact loading command.
Pick a body part, choose one or more anatomy labels, and select an imaging modality — the explorer lists the dataset configs
that fit. Choose one, pin an annotation version, and say whether you want the test split (the benchmark
set) or the train split (the source of MedVision-V0’s post-training data) — the panel writes a ready-to-run
load_dataset(...) snippet for exactly that choice. Subjects are split 70/30%, and each split is its own
config name, so switching moves both the name= and the split=. Covers the three
quantitative tasks: detection (bounding box), tumor/lesion size (T/L), and angle/distance (A/D).
📌 Annotation Version Control
MedVision annotations are versioned. MedVision_PLANNER_VERSION chooses which ones you load, and
the loader will not start without it. Setting it to latest is recommended.
The rest of this section is only for pinning an older version.
The setting is a ceiling, not an exact match: you get the newest annotations published at or before the version you name, separately for each annotation type.
Pinning below a dataset’s newest annotation needs acknowledgement. Say you
pinned 1.1.0, and release 1.1.1 later fixed an error and updated the annotations.
Since the data loader defaults to updating the dataset codebase medvision_ds first, it
checks the newest annotation version against the one you pinned. If the requested version
is older than the latest, loading pauses and you are prompted to read the release note.
Read it carefully to judge whether the update is essential. You can then take the updated
version, or keep the old one by setting MedVision_ACK_RELEASE to either of the values below.
1.1.1— that dataset’s newest annotation. It goes stale on purpose: correct that data again and the number changes, so you are asked again.1.4.0— the release. Reads as I have read release1.4.0. Use it for a sweep: one variable holds one value, but a sweep spans datasets at different newest versions, so only the release clears them all. It always names the current release, so a1.3.0acknowledgement no longer clears anything; a per-dataset value like1.1.1still does, because that dataset’s annotations did not change.
In the selector below, rows are datasets and the first three columns are detection, tumor/lesion size and angle/distance. A cell’s bars are that config’s annotation versions: the highlighted bar is what you get, and a bar to its right is a newer annotation you are skipping. Its number — the value to acknowledge with — repeats in the last column. Any other value is refused.
Full detail in the 📚 v1.4.0 release note · 📚 v1.3.0 release note · 📚 v1.2.1 release note · 📚 v1.2.0 release note · 📚 loading a config
🐛 Report an Issue
MedVision distributes only the annotations — the raw imaging is fetched from 31 upstream hosts, each of which can move, re-license or retire its files without notice. If something breaks, please tell us: 🧑🏻💻 open an issue on GitHub.
Worth reporting:
- A raw-data download fails. Usually an upstream source has moved or removed its archive, leaving a stale link in the download script.
- An annotation looks wrong. A label name, mask, measurement or landmark that does not match the image.
Please include the code snippet and the full error message.
🤝 Contribute Data
Two kinds of data contribution are especially welcome.
1. Suggest a public dataset. If you know a public medical imaging dataset whose license permits redistribution, and it carries what MedVision measures — segmentation masks, landmarks, or anything a physical measurement can be derived from, with spacing metadata in the header — propose it in 🧑🏻💻 a GitHub issue. We will look at integrating it on the same terms as the other 31: RAS+ volumes, the same config grammar, and targets in real-world units. The 📚 dataset guide walks through how a dataset is added.
2. Own proprietary data? Let’s build a challenge. If you hold data you cannot release outright, we are interested in partnering on a challenge around it: a public split for training alongside a private test set for fair model comparison. Please get in touch. Contact: 🌏 homepage.
📄 How to Cite
MedVision is a meta-dataset, and any use of it draws on two distinct contributions. The imaging data, segmentation masks and accompanying metadata are contributed by the source dataset providers; the quantitative annotations derived from them — bounding boxes, tumor/lesion sizes, and angle/distance measurements — are contributed by MedVision. Please credit both: cite the publication accompanying each source dataset you use, together with the MedVision paper.
A methods or data-availability statement might read:
Imaging data and segmentation masks were obtained from AbdomenAtlas (Li et al., 2024); the quantitative annotations used in this study were provided by MedVision (Yao et al., 2026).
Finding the source publication. Select a dataset in the 🔎 Dataset Explorer above — each dataset panel lists its Paper, Website, Source and License, so the reference you need for any config is already on this page. Several datasets record more than one publication; cite every entry listed.
Citing a source dataset is not a substitute for complying with its terms. The licence of each source dataset continues to govern how its imaging may be used and redistributed, independently of MedVision’s own licence. The BibTeX entry for MedVision is at the foot of this page.