🌟 Highlights
- Research gap. Modern VLMs cannot reliably produce precise quantitative measurements from medical images.
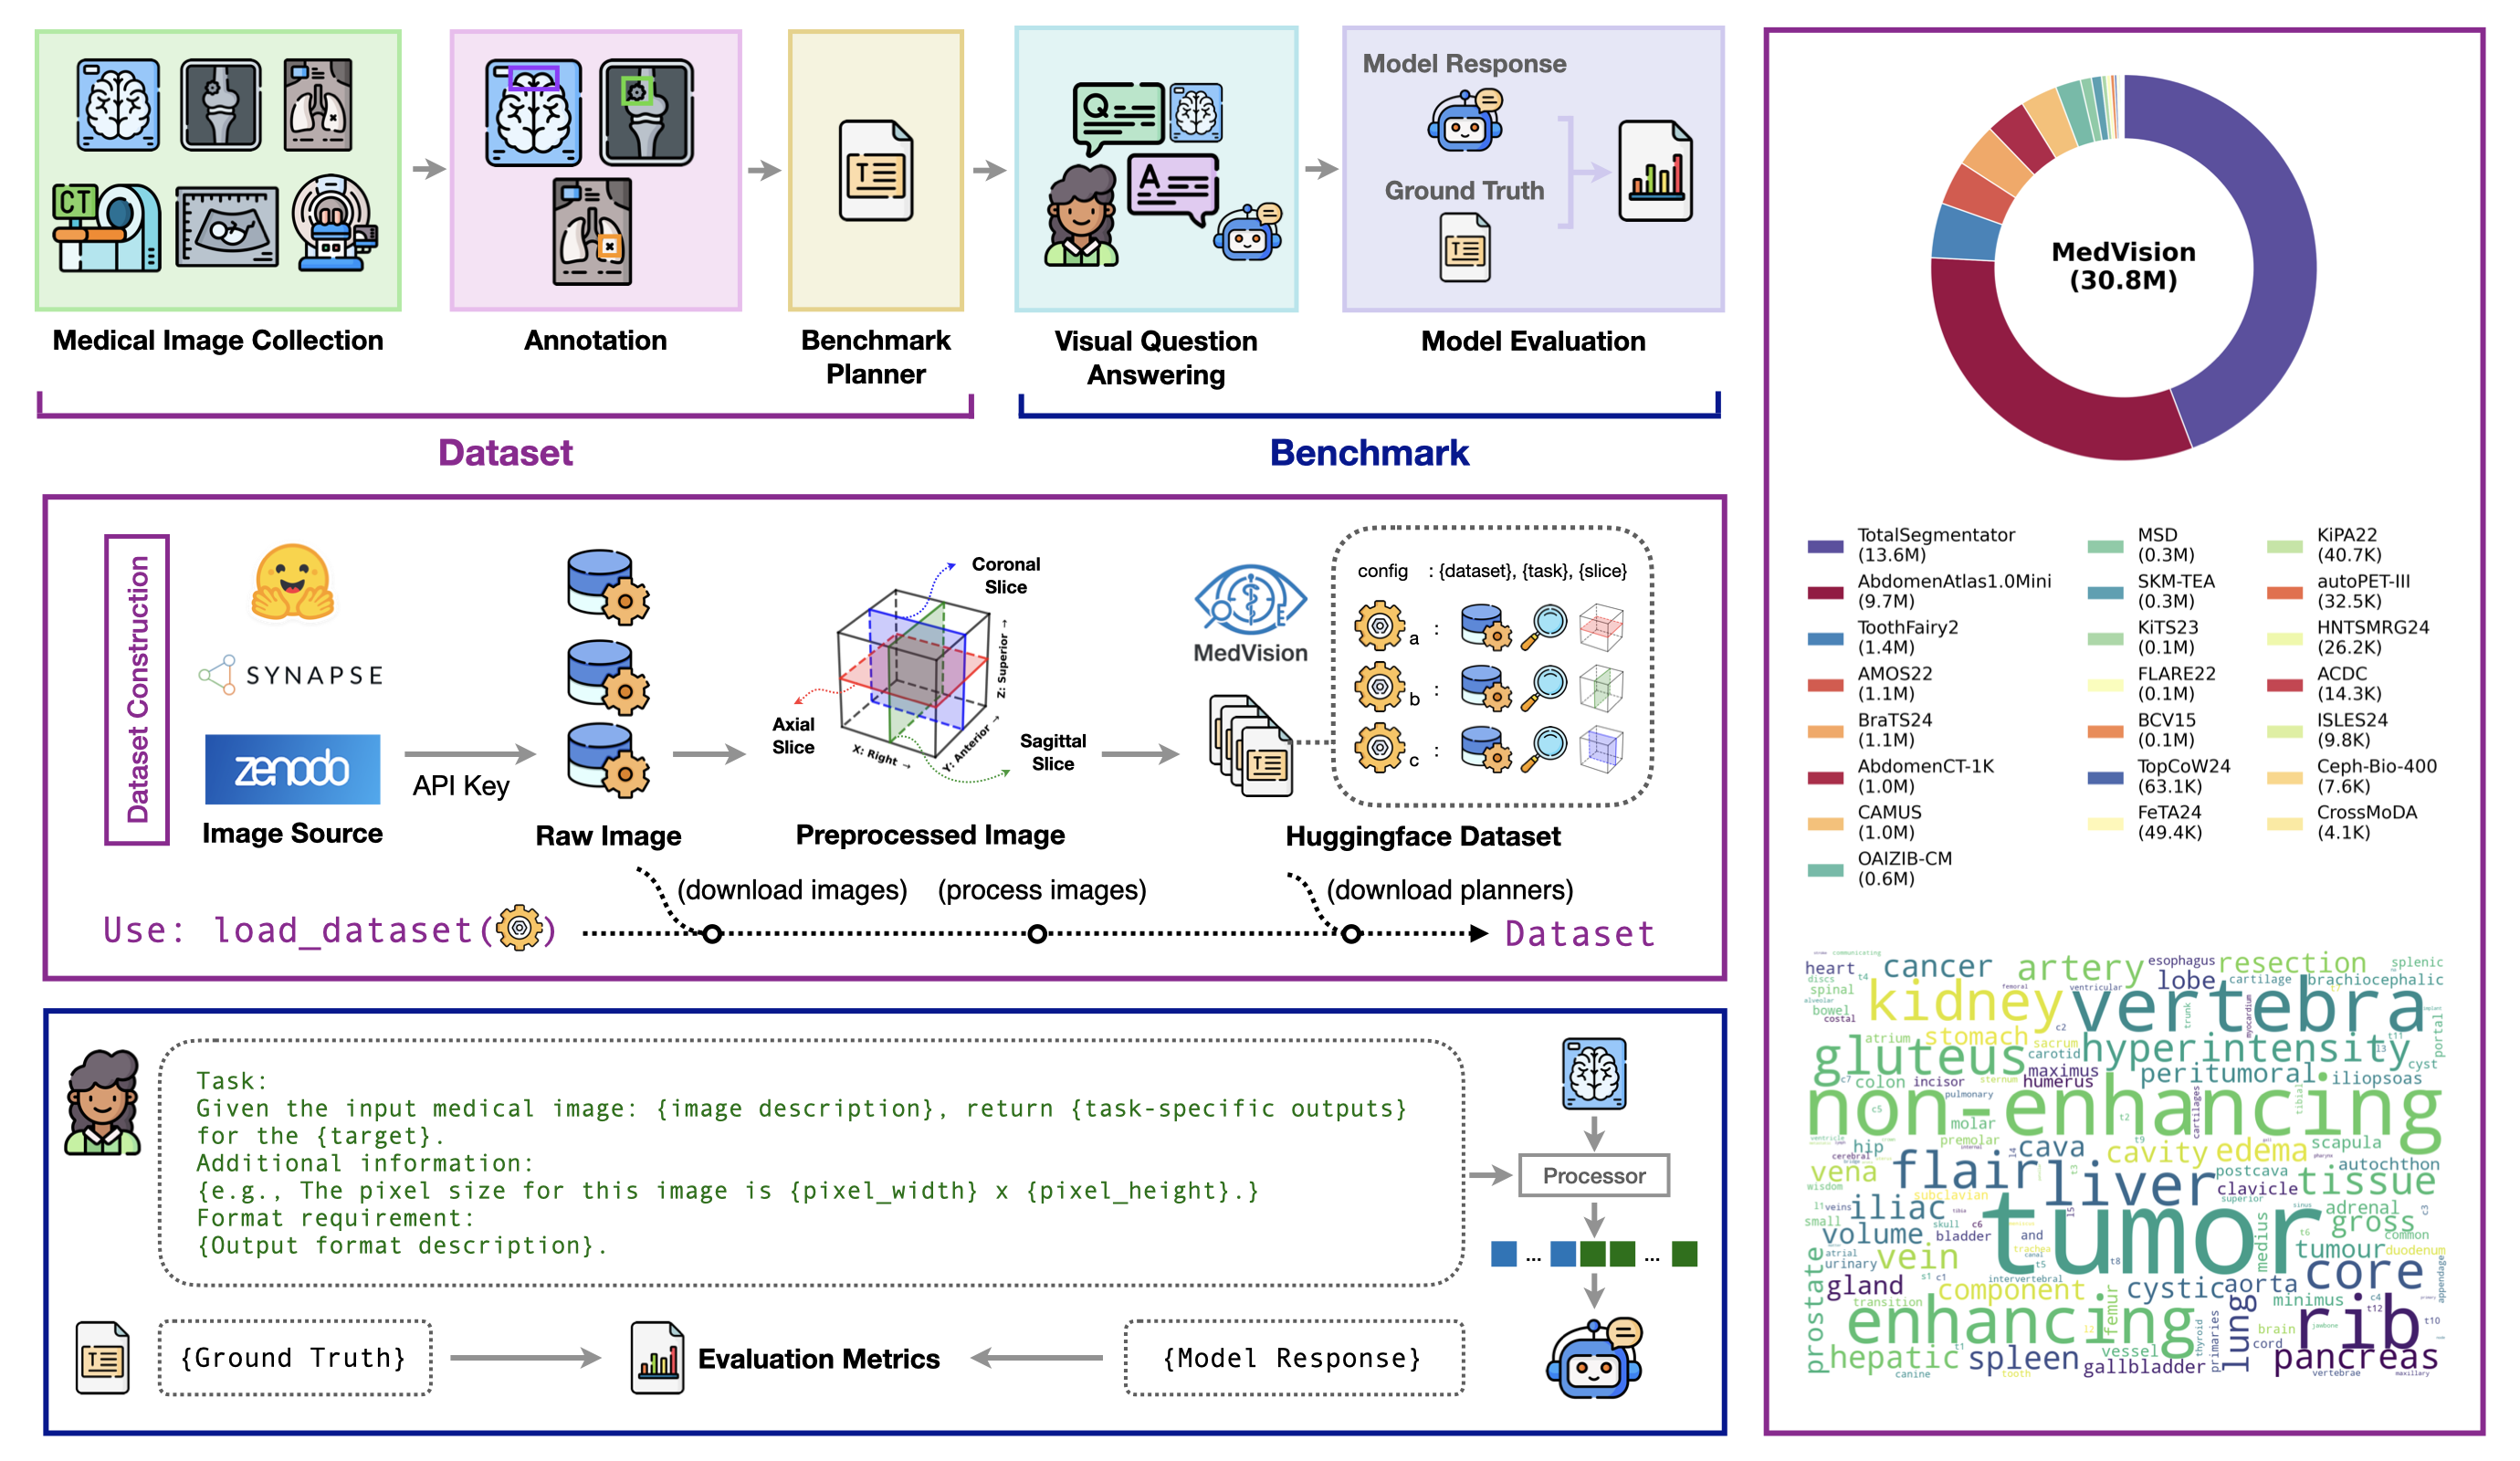
- Dataset. MedVision — a large-scale, multi-anatomy, multi-modality dataset for quantitative medical image analysis (30 public datasets, 32.7K 3D images, 11.9M annotated 2D slices, 24.7M single-instance annotations, and 46.7M multi-instance annotations).
- Benchmark. The first comprehensive evaluation of contemporary VLMs on detection, tumor/lesion (T/L) size estimation, and angle/distance (A/D) measurement in medical images.
- Model. MedVision-V0, a 7B model trained on MedVision via supervised fine-tuning (SFT) and reinforcement fine-tuning (RFT); it significantly outperforms all evaluated VLMs across all three tasks — a strong, open baseline.
- Open release. Data, model, and code (training and evaluation) are all publicly available.
🎯 Problem & Tasks
Clinical decisions rely on quantitative assessment — measuring a tumor to stage disease, a joint angle to plan surgery, an anatomical distance to track development. We therefore target a concrete model ability: given a medical image, produce precise numeric measurements in real-world physical units (millimeters and degrees, not pixels).
MedVision evaluates this ability across three quantitative tasks:
1️⃣ Detection
Localize healthy anatomical structures and abnormalities with bounding boxes.
2️⃣ Tumor/Lesion Size
Estimate the longest diameter (major axis) and its perpendicular diameter (minor axis) of a tumor/lesion, reported in millimeters.
3️⃣ Angle/Distance
Measure angles (degrees) and distances (mm) from anatomical landmarks.
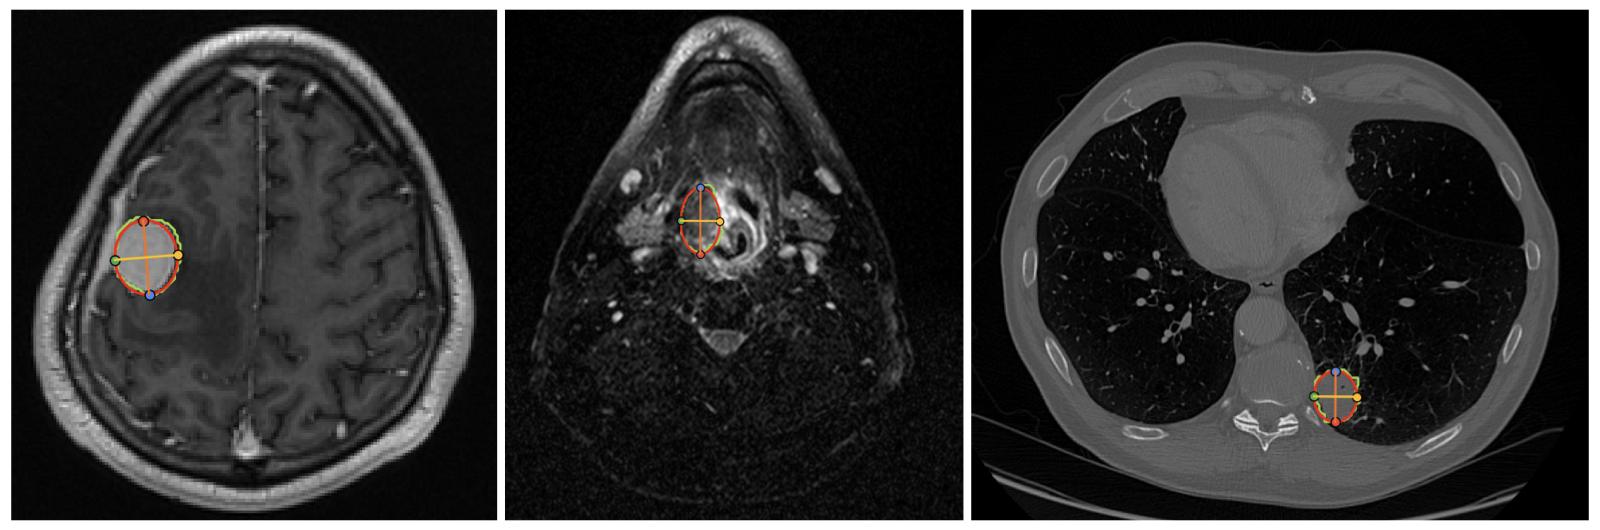
Figure 1: Tumor/lesion size annotation. An ellipse is fitted to the tumor/lesion mask and 4 landmarks are recorded.
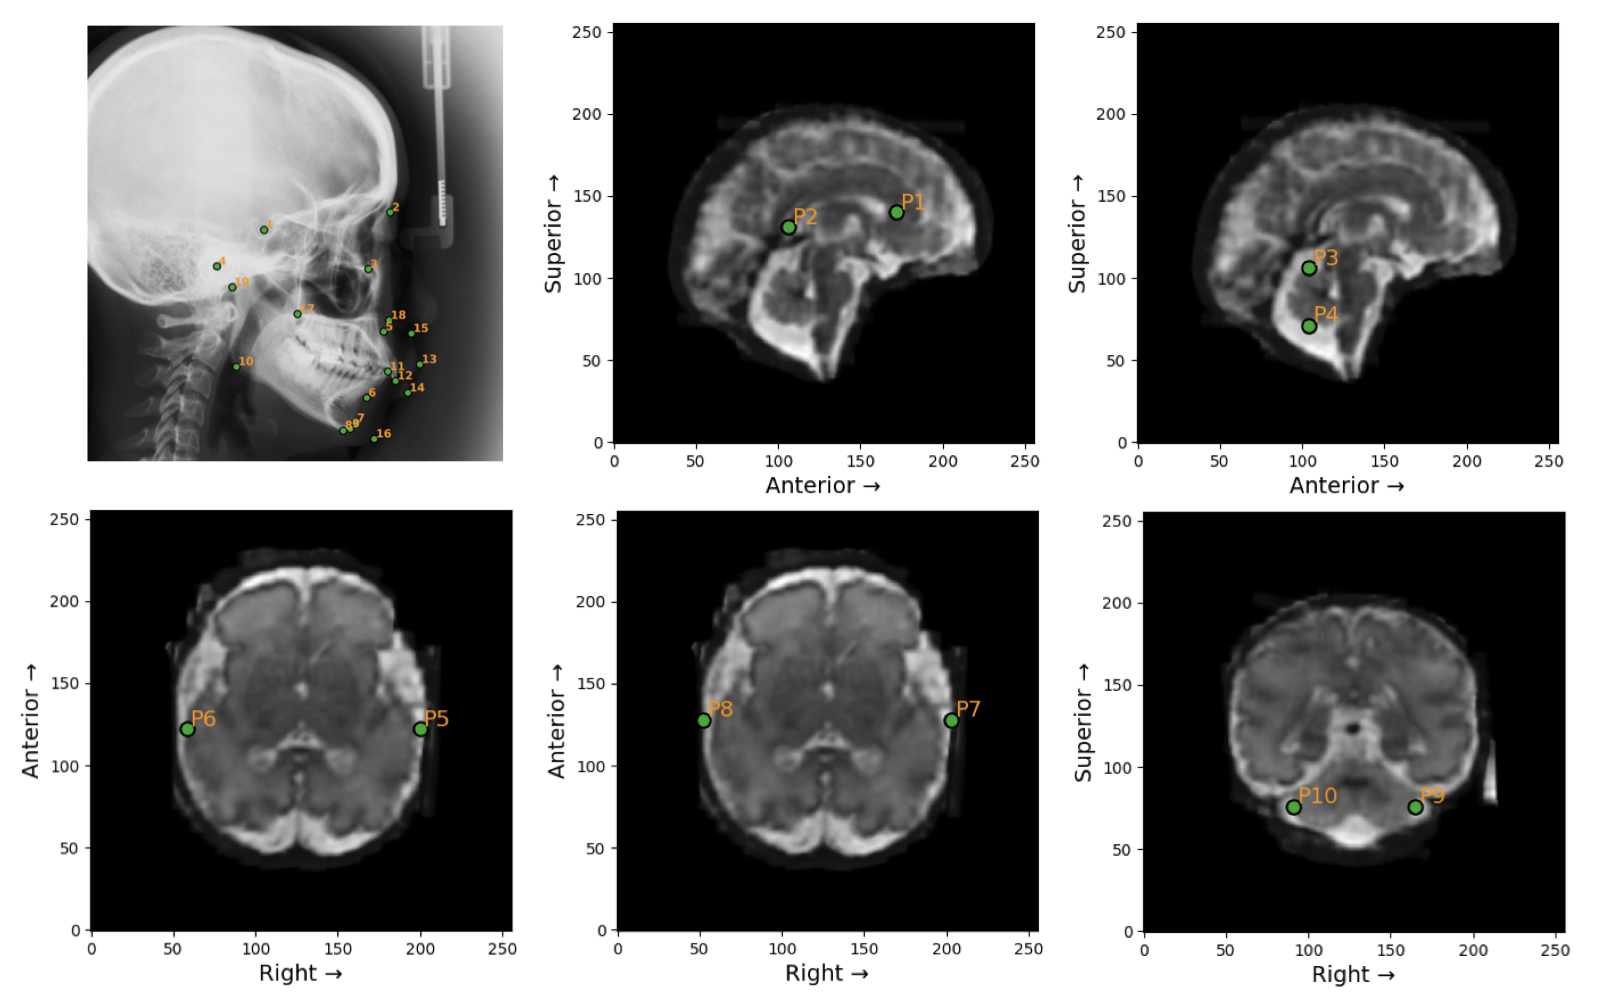
Figure 2: Landmarks in the Ceph-Bio-400 (top-left) and FeTA24 datasets. Ground truth angle and distance measurements are computed from these landmarks.
📈 Benchmark Results
MedVision-V0 outperforms all 17 evaluated off-the-shelf VLMs across all three quantitative task families. Each task below leads with the full leaderboard (🥇/🥈/🥉 mark the best three per column; click any metric to rank the table by it, best first; underlined metrics belong to a sub-task whose success rate fell below 50%, meaning they are computed on a minority of samples and should be read with care), followed by an interactive viewer of real predictions — the complete prompt, the model’s chain-of-thought response, and the error metrics, beside the image with a ground-truth-vs-prediction overlay.
1️⃣ Detection
Table 2: Detection performance (%), grouped into anatomy and tumor/lesion targets. R: recall; P: precision; F1: F1 score; IoU: intersection over union; SR: success rate.
| Model | Anatomy (18 regions, 13.4K samples) | Tumor/Lesion (8 regions, 8.5K samples) | ||||||||||
|---|---|---|---|---|---|---|---|---|---|---|---|---|
| R ↑ | P ↑ | F1 ↑ | IoU ↑ | SR ↑ | IoU>0.5 ↑ | R ↑ | P ↑ | F1 ↑ | IoU ↑ | SR ↑ | IoU>0.5 ↑ | |
| MedVision-V0 (7B) | 81.3🥇 | 80.4🥇 | 79.1🥇 | 72.0🥇 | 100 | 80.1🥇 | 52.4 | 50.5🥇 | 46.9🥇 | 38.2🥇 | 100 | 40.7🥇 |
| Gemma-4 (31B) | 34.7 | 20.6🥈 | 22.5🥈 | 16.7🥈 | 98.1 | 13.5🥈 | 43.6 | 14.6🥈 | 18.1🥈 | 12.7🥈 | 99.2 | 8.4🥈 |
| Lingshu (32B) | 37.4 | 20.2🥉 | 20.2🥉 | 13.7🥉 | 100 | 6.7 | 40.2 | 6.0 | 8.6 | 5.1 | 100 | 0.2 |
| Qwen3-VL-Thinking (32B) | 35.5 | 17.3 | 19.4 | 13.3 | 95.5 | 7.5🥉 | 33.5 | 6.6 | 8.2 | 5.1 | 97.2 | 1.3 |
| MedGemma (27B) | 56.4 | 15.5 | 18.8 | 12.7 | 97.1 | 6.6 | 52.7 | 4.5 | 7.4 | 4.2 | 94.4 | 0.1 |
| MedGemma (4B) | 68.6🥉 | 14.6 | 18.5 | 12.4 | 98.2 | 6.4 | 77.6🥇 | 4.4 | 7.4 | 4.2 | 99.1 | 0.0 |
| Qwen2.5-VL (32B) | 44.8 | 14.9 | 18.4 | 12.5 | 100 | 6.3 | 38.5 | 5.7 | 7.7 | 4.7 | 100 | 0.6 |
| LLaVA-OneVision (72B) | 34.9 | 19.0 | 18.1 | 11.8 | 100 | 2.4 | 34.1 | 6.3 | 8.4 | 5.0 | 100 | 0.4 |
| MiniMax-M3 (428B, int4) | 32.5 | 15.4 | 17.5 | 11.8 | 99.7 | 5.6 | 35.7 | 7.8🥉 | 10.2🥉 | 6.4🥉 | 100 | 1.6🥉 |
| InternVL3 (38B) | 31.1 | 17.0 | 17.2 | 11.5 | 100 | 5.3 | 29.5 | 6.6 | 7.9 | 4.9 | 100 | 0.8 |
| Qwen2.5-VL (7B) | 69.6🥈 | 12.2 | 16.7 | 11.3 | 99.3 | 5.6 | 77.4🥈 | 3.8 | 6.5 | 3.6 | 99.6 | 0.0 |
| GLM-4.6V-Flash (9B) | 22.6 | 17.6 | 15.2 | 9.8 | 99.9 | 2.5 | 26.2 | 6.1 | 7.5 | 4.7 | 99.8 | 1.0 |
| Gemma-3 (27B) | 37.1 | 12.4 | 14.9 | 10.1 | 100 | 4.6 | 34.3 | 4.3 | 6.1 | 3.6 | 100 | 0.3 |
| HealthGPT (14B) | 27.3 | 19.4 | 14.9 | 9.5 | 92.0 | 1.7 | 25.6 | 5.9 | 7.1 | 4.4 | 82.6 | 0.5 |
| MedDr (40B) | 53.2 | 11.1 | 14.6 | 9.6 | 96.2 | 4.1 | 63.2🥉 | 3.7 | 6.2 | 3.5 | 98.5 | 0.1 |
| HuatuoGPT-Vision (34B) | 21.2 | 14.1 | 12.3 | 8.0 | 80.0 | 2.2 | 17.8 | 4.0 | 5.1 | 3.1 | 76.6 | 0.3 |
| GLM-4.6V (106B) | 28.1 | 9.1 | 11.4 | 7.5 | 61.0 | 3.0 | 32.5 | 3.0 | 4.6 | 2.7 | 60.7 | 0.2 |
| Llama-3.2-Vision (11B) | 41.9 | 8.6 | 10.7 | 7.1 | 70.0 | 2.5 | 43.4 | 2.3 | 3.8 | 2.1 | 68.6 | 0.0 |
2️⃣ Tumor/Lesion Size
Table 3: Tumor/lesion size estimation (2K samples). MAE in millimeters; MRE, SR, and MRE<0.1 in %.
| Model | MAE ↓ | MRE ↓ | SR ↑ | MRE<0.1 ↑ |
|---|---|---|---|---|
| MedVision-V0 (7B) | 10.5🥇 | 25.9🥇 | 100.0 | 23.5🥇 |
| Gemma-4 (31B) | 21.8🥈 | 72.7🥈 | 98.9 | 16.8🥈 |
| MiniMax-M3 (428B, int4) | 32.5 | 107.5🥉 | 86.2 | 5.2 |
| GLM-4.6V (106B) | 31.6🥉 | 108.0 | 90.0 | 3.9 |
| GLM-4.6V-Flash (9B) | 34.4 | 109.5 | 91.7 | 2.9 |
| Lingshu (32B) | 35.7 | 118.6 | 99.5 | 4.5 |
| Qwen3-VL-Thinking (32B) | 52.9 | 140.1 | 93.8 | 6.2🥉 |
| HealthGPT (14B) | 51.8 | 176.0 | 100.0 | 2.2 |
| Gemma-3 (27B) | 226.0 | 611.8 | 99.0 | 0.5 |
| LLaVA-OneVision (72B) | 1089.1 | 3368.0 | 100.0 | 1.2 |
| Qwen2.5-VL (7B) | 2935.4 | 7744.8 | 95.4 | 0.7 |
| InternVL3 (38B) | 8606.8 | 25285.1 | 100.0 | 0.2 |
| MedGemma (4B) | 755390.6 | 2374502.3 | 81.6 | 0.1 |
| HuatuoGPT-Vision (34B) | 47.5 | 142.2 | 16.2 | 0.7 |
| MedDr (40B) | 93.8 | 294.5 | 54.5 | 0.4 |
| Llama-3.2-Vision (11B) | 136.3 | 350.9 | 14.6 | 0.1 |
| MedGemma (27B) | 547.6 | 1772.6 | 52.5 | 0.7 |
| Qwen2.5-VL (32B) | 2721.5 | 10471.5 | 16.5 | 0.1 |
3️⃣ Angle/Distance
Table 4: Angle/distance measurement across all 17 off-the-shelf VLMs and MedVision-V0, for each sub-task. MAE in millimeters (distance) and degrees (angle); MRE, SR, and MRE<0.1 in %.
| Model | Ceph-Bio-400 · Distance (1000 samples) | FeTA24 · Distance (100 samples) | ||||||
|---|---|---|---|---|---|---|---|---|
| MAE ↓ | MRE ↓ | SR ↑ | MRE<0.1 ↑ | MAE ↓ | MRE ↓ | SR ↑ | MRE<0.1 ↑ | |
| MedVision-V0 (7B) | 3.4🥇 | 5.4🥇 | 100 | 85.3🥇 | 5.6🥇 | 15.8🥇 | 100 | 42.0🥇 |
| GLM-4.6V-Flash (9B) | 30.6 | 47.1 | 81.8 | 7.9 | 32.3 | 141.9 | 90.0 | 7.0 |
| Gemma-4 (31B) | 24.6 | 34.8 | 99.8 | 10.7 | 16.0🥈 | 68.5🥈 | 100 | 12.0 |
| Qwen3-VL-Thinking (32B) | 127.8 | 205.3 | 98.0 | 19.6 | 30.9 | 123.2 | 99.0 | 7.0 |
| HealthGPT (14B) | 22.7 | 33.1🥉 | 99.7 | 19.0 | 27.0 | 134.9 | 76.0 | 8.0 |
| Lingshu (32B) | 214.4 | 257.6 | 100 | 23.5🥈 | 43.5 | 148.4 | 100 | 0.0 |
| MedDr (40B) | 110.1 | 175.4 | 60.4 | 5.0 | 136.0 | 599.2 | 70.0 | 0.0 |
| LLaVA-OneVision (72B) | 2399.1 | 3543.4 | 100 | 5.3 | 3967.4 | 14694.4 | 100 | 14.0🥉 |
| Gemma-3 (27B) | 5563.4 | 7261.7 | 98.4 | 13.5 | 35.1 | 173.3 | 100 | 9.0 |
| MedGemma (4B) | 16767.3 | 27429.4 | 95.4 | 0.1 | 51.3 | 135.8 | 87.0 | 0.0 |
| InternVL3 (38B) | 67516.4 | 65356.7 | 99.8 | 7.1 | 7571.4 | 30542.5 | 100 | 17.0🥈 |
| Qwen2.5-VL (7B) | 68610.5 | 101639.4 | 100 | 0.5 | 13536.3 | 45568.5 | 81.0 | 0.0 |
| GLM-4.6V (106B) | 21.1🥉 | 33.3 | 51.5 | 9.4 | 32.0 | 141.4 | 67.0 | 5.0 |
| MiniMax-M3 (428B, int4) | 17.1🥈 | 25.4🥈 | 87.3 | 21.5🥉 | 20.9🥉 | 71.8🥉 | 98.0 | 6.0 |
| MedGemma (27B) | 28.8 | 48.0 | 33.5 | 4.7 | 41.5 | 194.3 | 43.0 | 2.0 |
| Qwen2.5-VL (32B) | 594.7 | 1022.1 | 8.7 | 0.5 | 1255.1 | 2515.8 | 31.0 | 0.0 |
| HuatuoGPT-Vision (34B) | 15855.7 | 16413.5 | 79.8 | 4.3 | 653.0 | 6436.1 | 55.0 | 1.0 |
| Llama-3.2-Vision (11B) | 27212.2 | 28002.2 | 12.7 | 0.5 | 3449.8 | 15044.3 | 17.0 | 0.0 |
| Model | Ceph-Bio-400 · Angle (957 samples) | |||
|---|---|---|---|---|
| MAE ↓ | MRE ↓ | SR ↑ | MRE<0.1 ↑ | |
| MedVision-V0 (7B) | 4.7🥇 | 52.1🥇 | 99.9 | 52.0🥇 |
| GLM-4.6V-Flash (9B) | 33.2 | 367.9 | 41.9 | 2.3 |
| Gemma-4 (31B) | 23.9 | 428.0 | 88.5 | 11.7 |
| Qwen3-VL-Thinking (32B) | 32.7 | 370.6 | 65.7 | 3.3 |
| HealthGPT (14B) | 27.8 | 588.2 | 86.7 | 16.5🥉 |
| Lingshu (32B) | 35.0 | 512.5 | 100 | 6.3 |
| MedDr (40B) | 47.3 | 615.8 | 71.8 | 5.0 |
| LLaVA-OneVision (72B) | 33.5 | 471.9 | 99.5 | 2.9 |
| Gemma-3 (27B) | 36.3 | 702.2 | 99.9 | 6.7 |
| MedGemma (4B) | 35.7 | 301.1 | 91.4 | 6.0 |
| InternVL3 (38B) | 30.3 | 616.8 | 100 | 20.4🥈 |
| Qwen2.5-VL (7B) | 48.0 | 724.9 | 97.6 | 2.0 |
| GLM-4.6V (106B) | 21.5🥉 | 253.5 | 30.5 | 5.0 |
| MiniMax-M3 (428B, int4) | 13.6🥈 | 401.9 | 15.2 | 3.8 |
| MedGemma (27B) | 42.7 | 971.4 | 54.8 | 2.8 |
| Qwen2.5-VL (32B) | 33.4 | 130.5🥈 | 7.5 | 0.1 |
| HuatuoGPT-Vision (34B) | 43.6 | 660.8 | 1.6 | 0.3 |
| Llama-3.2-Vision (11B) | 33.0 | 190.1🥉 | 84.4 | 2.6 |
🔬 Pilot Study: Frontier API Models
Running API-served frontier VLMs across the entire benchmark is prohibitively costly — the test set spans multiple tasks, each with a large number of samples. We therefore conduct a pilot study that evaluates frontier API models on a small testing subset per task (Tumor/Lesion Size for now), reusing the exact prompts and samples from the full benchmark. This pilot study benchmarks how capable today’s frontier models are at quantitative medical image measurement, facilitating the design of agentic AI systems for biomedical applications.
Table 5: Pilot study on tumor/lesion size estimation using a small testing subset (750 samples). MAE in millimeters; MRE, SR, and MRE<0.1 in %. Cost is the total API evaluation spend in USD. † Gemini-3.1-Pro's thinking (non-disableable, default level) shares its 16,000-token output budget with the answer; ~20% of responses exhaust it on reasoning and return empty/truncated output, lowering SR.
| Model | MAE ↓ | MRE ↓ | SR ↑ | MRE<0.1 ↑ | Cost |
|---|---|---|---|---|---|
| MedVision-V0 (7B) | 9.6🥇 | 26.9🥇 | 100.0 | 24.1🥇 | $0 |
| Claude-Fable-5 | 12.5 | 46.5 | 100.0 | 23.7 | $63.9 |
| Gemini-3.1-Pro | 15.2 | 49.9 | 79.2 † | 18.1 | $101.3 |
🤝 Call for Models
MedVision is an open, growing leaderboard — we keep adding models as the field moves. If there is a vision language model you would like to see evaluated on the benchmark, please 🧑🏻💻open a GitHub issue with the model name and a link to its weights or API, and we will consider it for a future evaluation round.
Pull requests are equally welcome. Our 📚 New Models Guide walks through everything needed to plug a new VLM into the benchmark — a PR contributing complete, working inference code for a model is the fastest route onto the leaderboard.