 MedVision: Benchmarking Quantitative Medical Image Analysis
MedVision v1.4.0: 50× More Tumor/Lesion Measurements and Their Annotation Recall
Summary. Dataset v1.4.0 rebuilds the tumor/lesion (T/L) size annotations of all 12 tumor and lesion collections. Clusters are selected by a physical size floor in millimetres instead of a raw pixel count, a containment test that discarded rotated ellipses is removed, and four guards bracket the ellipse fit. Published measurements increase from 75,840 to 3,801,540 (50×). This release also quantifies annotation recall for the first time: of 6,951,667 outlined clusters, 3,801,540 (0.547) carry a measurement, and recall reaches 0.992 for clusters at least 20 mm long.
Background
Tumor and lesion size is a quantitative clinical endpoint. It informs staging, treatment selection, and response assessment across successive scans. MedVision evaluates whether vision language models can recover that quantity from medical images, which requires a reference standard: a large image corpus in which the physical size of each tumor or lesion is known.
Measurement procedure
Every volume in these collections carries expert segmentation masks of diseased tissue. On each slice, every connected component of a target-label mask (a cluster) is fitted with an ellipse, and the major and minor axis lengths are recorded in millimetres, mirroring how a radiologist sizes a lesion. Those lengths are the reference values against which a model is graded.
Because the fit is automatic, the rules that decide which clusters are measured and which fits are trustworthy determine the composition of the dataset. v1.4.0 revises those rules.
Changes in v1.4.0
No measurement published by an earlier version was incorrect. The earlier rules were restrictive in ways that left many measurable lesions out, and the extent of that loss had never been quantified.
1. Selection in millimetres rather than pixels. A pixel is not a fixed physical size: it varies between scanners and between viewing directions within one volume. On a case of 0.977/0.977/3.0 mm spacing, the earlier 20 px floor cut at approximately 4.9 mm in the axial plane but 8.6 mm in the sagittal plane, a 3.07× difference in area behind a single number. v1.4.0 measures a cluster when its fitted major axis clears max(2.0 mm, 2× the coarser in-plane spacing), a resolution floor applied identically to every image.
2. Removal of the orientation-sensitive containment test. The earlier rule required the fitted ellipse to lie inside a box around the cluster, which tests shape and rotation rather than size: a tilted ellipse protrudes from an axis-aligned box regardless of fit quality. Most of the 50× growth is attributable to this removal rather than to the lower floor.
3. Four guards on the fit. Fitting millions of contours automatically admits rare degenerate solutions. v1.4.0 rejects contours under 5 points, non-finite conics, minor axes thinner than one voxel, and major axes exceeding 1.5× the cluster’s own bounding-box diagonal. The logged guards rejected 95,800 fits corpus-wide.
Measurement distribution
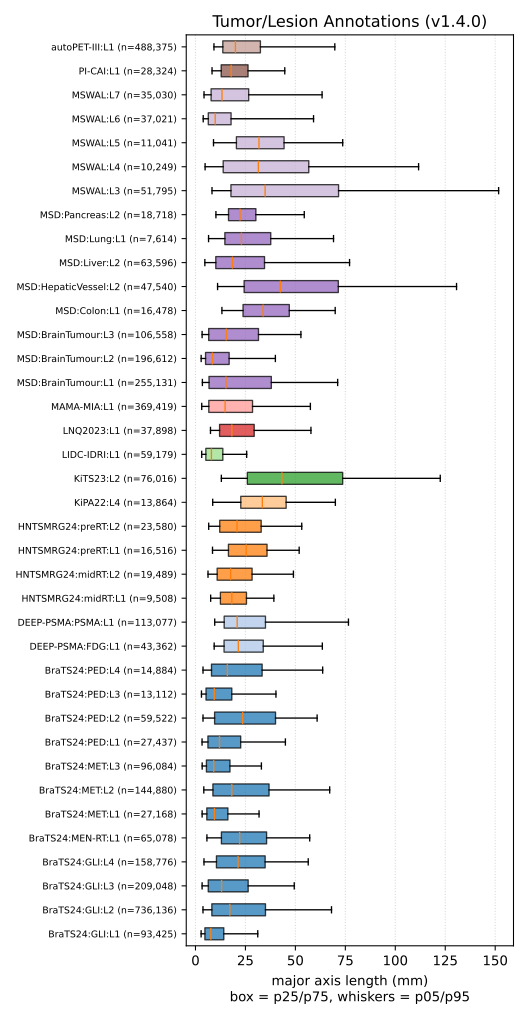
Distribution of the major axis for all 3,801,540 measurements. Each row is one of the 38 tumor or lesion labels; the box spans the interquartile range and the whiskers the central 90%, in millimetres.
The median major axis spans 7.7 mm (non-enhancing brain tumor core, BraTS24-GLI) to 43.3 mm (kidney tumor, KiTS23), so a single expected size does not generalise across diseases. The largest measurement in the corpus, 540.1 mm.
Annotation recall
Recall is measured clusters divided by all clusters, with the denominator obtained by recounting the expert masks directly rather than by reading the annotation plan. Across the 12 collections the masks contain 6,951,667 clusters, of which 3,801,540 (0.547) carry a measurement.
Recall by cluster size in pixels
| Per bin | Cumulative recall (≤ t) | Recall above threshold (> t) | |||||||||
|---|---|---|---|---|---|---|---|---|---|---|---|
| Cluster size | Clusters | Measured | Recall | Cluster size | Clusters | Measured | Recall | Cluster size | Clusters | Measured | Recall |
| 1–2 px | 1,872,149 | 0 | 0.000 | ≤2 px | 1,872,149 | 0 | 0.000 | >2 px | 5,079,518 | 3,801,540 | 0.748 |
| 3–5 px | 831,751 | 34,347 | 0.041 | ≤5 px | 2,703,900 | 34,347 | 0.013 | >5 px | 4,247,767 | 3,767,193 | 0.887 |
| 6–10 px | 665,002 | 324,716 | 0.488 | ≤10 px | 3,368,902 | 359,063 | 0.107 | >10 px | 3,582,765 | 3,442,477 | 0.961 |
| 11–20 px | 649,587 | 551,337 | 0.849 | ≤20 px | 4,018,489 | 910,400 | 0.227 | >20 px | 2,933,178 | 2,891,140 | 0.986 |
| 21–50 px | 756,110 | 723,779 | 0.957 | ≤50 px | 4,774,599 | 1,634,179 | 0.342 | >50 px | 2,177,068 | 2,167,361 | 0.996 |
| 51–100 px | 490,959 | 485,418 | 0.989 | ≤100 px | 5,265,558 | 2,119,597 | 0.403 | >100 px | 1,686,109 | 1,681,943 | 0.998 |
| 101–500 px | 1,003,733 | 999,961 | 0.996 | ≤500 px | 6,269,291 | 3,119,558 | 0.498 | >500 px | 682,376 | 681,982 | 0.999 |
| 501–1000 px | 346,583 | 346,242 | 0.999 | ≤1000 px | 6,615,874 | 3,465,800 | 0.524 | >1000 px | 335,793 | 335,740 | 1.000 |
| >1000 px | 335,793 | 335,740 | 1.000 | All | 6,951,667 | 3,801,540 | 0.547 | ||||
The first block is the recall of each bin in isolation. The second accumulates the bins upward from the smallest, the cumulative recall in the usual sense, and closes on the corpus total. The third pools every cluster above a threshold, which is the quantity a user of the dataset sees when selecting lesions above a size floor; the second and third blocks at one threshold partition the corpus exactly. Read from the third block, recall is 0.961 for clusters >10 px and 0.986 for clusters >20 px: the floor and the fit guards remove sub-resolution fragments, not measurable lesions. The fragment shares come from the second block, converted from cluster counts to unmeasured counts by subtracting the measured column from the clusters column in the same row:
The unmeasured remainder is dominated by fragments: 95.5% of unmeasured clusters are ≤10 px and 84.7% are ≤5 px. The corpus value of 0.547 therefore counts components, not clinically measurable lesions. The pixel table below supports those shares, and the two physical stratifications that follow separate the two quantities; each table partitions the same 6,951,667 clusters and reproduces the same margins.
unmeasured, all sizes = 6,951,667 - 3,801,540 = 3,150,127
unmeasured ≤10 px     = 3,368,902 -   359,063 = 3,009,839    ->  3,009,839 / 3,150,127 = 0.955
unmeasured ≤5 px      = 2,703,900 -    34,347 = 2,669,553    ->  2,669,553 / 3,150,127 = 0.847
Clusters of 1–2 px, over a quarter of the corpus, cannot yield the 5-point contour the ellipse fit requires, so their recall is 0 by construction rather than by threshold.
Recall by major axis length
Length is the maximum Feret diameter of a cluster in millimetres, the mask-side proxy for the fitted major axis on which the selection rule acts.
| Per bin | Cumulative recall (≤ t) | Recall above threshold (> t) | |||||||||
|---|---|---|---|---|---|---|---|---|---|---|---|
| Cluster length | Clusters | Measured | Recall | Cluster length | Clusters | Measured | Recall | Cluster length | Clusters | Measured | Recall |
| ≤2 mm | 2,232,427 | 1,952 | 0.001 | ≤2 mm | 2,232,427 | 1,952 | 0.001 | >2 mm | 4,719,240 | 3,799,588 | 0.805 |
| 2–5 mm | 974,881 | 409,412 | 0.420 | ≤5 mm | 3,207,308 | 411,364 | 0.128 | >5 mm | 3,744,359 | 3,390,176 | 0.905 |
| 5–10 mm | 955,724 | 694,683 | 0.727 | ≤10 mm | 4,163,032 | 1,106,047 | 0.266 | >10 mm | 2,788,635 | 2,695,493 | 0.967 |
| 10–20 mm | 1,055,235 | 976,105 | 0.925 | ≤20 mm | 5,218,267 | 2,082,152 | 0.399 | >20 mm | 1,733,400 | 1,719,388 | 0.992 |
| 20–50 mm | 1,263,241 | 1,250,268 | 0.990 | ≤50 mm | 6,481,508 | 3,332,420 | 0.514 | >50 mm | 470,159 | 469,120 | 0.998 |
| 50–100 mm | 413,816 | 412,849 | 0.998 | ≤100 mm | 6,895,324 | 3,745,269 | 0.543 | >100 mm | 56,343 | 56,271 | 0.999 |
| >100 mm | 56,343 | 56,271 | 0.999 | All | 6,951,667 | 3,801,540 | 0.547 | ||||
Read from the third block, recall is 0.967 for clusters >10 mm and 0.992 for clusters >20 mm.
The same table sizes the unmeasured remainder in physical units, and the result is that very few unmeasured clusters are large lesions: of the 3,150,127 unmeasured clusters, 88.8% are ≤5 mm, 97.0% are ≤10 mm, and only 14,012 (0.44%) are longer than 20 mm. Each share is derived as before — clusters minus measured, in the row at that threshold, over the corpus-wide unmeasured total:
unmeasured, all lengths = 6,951,667 - 3,801,540 = 3,150,127
unmeasured ≤5 mm        = 3,207,308 -   411,364 = 2,795,944  ->  2,795,944 / 3,150,127 = 0.888
unmeasured ≤10 mm       = 4,163,032 - 1,106,047 = 3,056,985  ->  3,056,985 / 3,150,127 = 0.970
unmeasured >20 mm       = 1,733,400 - 1,719,388 =    14,012  ->     14,012 / 3,150,127 = 0.0044
Recall by cluster area
Area is the physical area of the cluster on its slice in mm², derived from the same recount.
| Per bin | Cumulative recall (≤ t) | Recall above threshold (> t) | |||||||||
|---|---|---|---|---|---|---|---|---|---|---|---|
| Cluster area | Clusters | Measured | Recall | Cluster area | Clusters | Measured | Recall | Cluster area | Clusters | Measured | Recall |
| ≤2 mm² | 1,684,011 | 64 | 0.000 | ≤2 mm² | 1,684,011 | 64 | 0.000 | >2 mm² | 5,267,656 | 3,801,476 | 0.722 |
| 2–5 mm² | 696,041 | 40,093 | 0.058 | ≤5 mm² | 2,380,052 | 40,157 | 0.017 | >5 mm² | 4,571,615 | 3,761,383 | 0.823 |
| 5–10 mm² | 526,878 | 237,702 | 0.451 | ≤10 mm² | 2,906,930 | 277,859 | 0.096 | >10 mm² | 4,044,737 | 3,523,681 | 0.871 |
| 10–20 mm² | 545,631 | 371,569 | 0.681 | ≤20 mm² | 3,452,561 | 649,428 | 0.188 | >20 mm² | 3,499,106 | 3,152,112 | 0.901 |
| 20–50 mm² | 725,574 | 530,074 | 0.731 | ≤50 mm² | 4,178,135 | 1,179,502 | 0.282 | >50 mm² | 2,773,532 | 2,622,038 | 0.945 |
| 50–100 mm² | 582,689 | 467,469 | 0.802 | ≤100 mm² | 4,760,824 | 1,646,971 | 0.346 | >100 mm² | 2,190,843 | 2,154,569 | 0.983 |
| 100–500 mm² | 1,347,005 | 1,311,216 | 0.973 | ≤500 mm² | 6,107,829 | 2,958,187 | 0.484 | >500 mm² | 843,838 | 843,353 | 0.999 |
| 500–1000 mm² | 428,510 | 428,120 | 0.999 | ≤1000 mm² | 6,536,339 | 3,386,307 | 0.518 | >1000 mm² | 415,328 | 415,233 | 1.000 |
| >1000 mm² | 415,328 | 415,233 | 1.000 | All | 6,951,667 | 3,801,540 | 0.547 | ||||
Read from the third block as before, recall reaches 0.983 for clusters >100 mm² and 0.999 for clusters >500 mm². Area does not determine the major axis: at a fixed area an elongated cluster has a longer major axis than a compact one and is more likely to clear the floor, while the thinnest clusters are removed by the sub-voxel minor-axis guard. Length, the variable the rule acts on, is therefore the sharper predictor of recall, and the area view describes the same corpus with shapes mixed together.
The unmeasured remainder concentrates at the bottom of this ladder as it does on the other two: 83.5% of the 3,150,127 unmeasured clusters are ≤10 mm² and 89.0% are ≤20 mm², derived as before:
unmeasured, all areas = 6,951,667 - 3,801,540 = 3,150,127
unmeasured ≤10 mm²    = 2,906,930 -   277,859 = 2,629,071  ->  2,629,071 / 3,150,127 = 0.835
unmeasured ≤20 mm²    = 3,452,561 -   649,428 = 2,803,133  ->  2,803,133 / 3,150,127 = 0.890
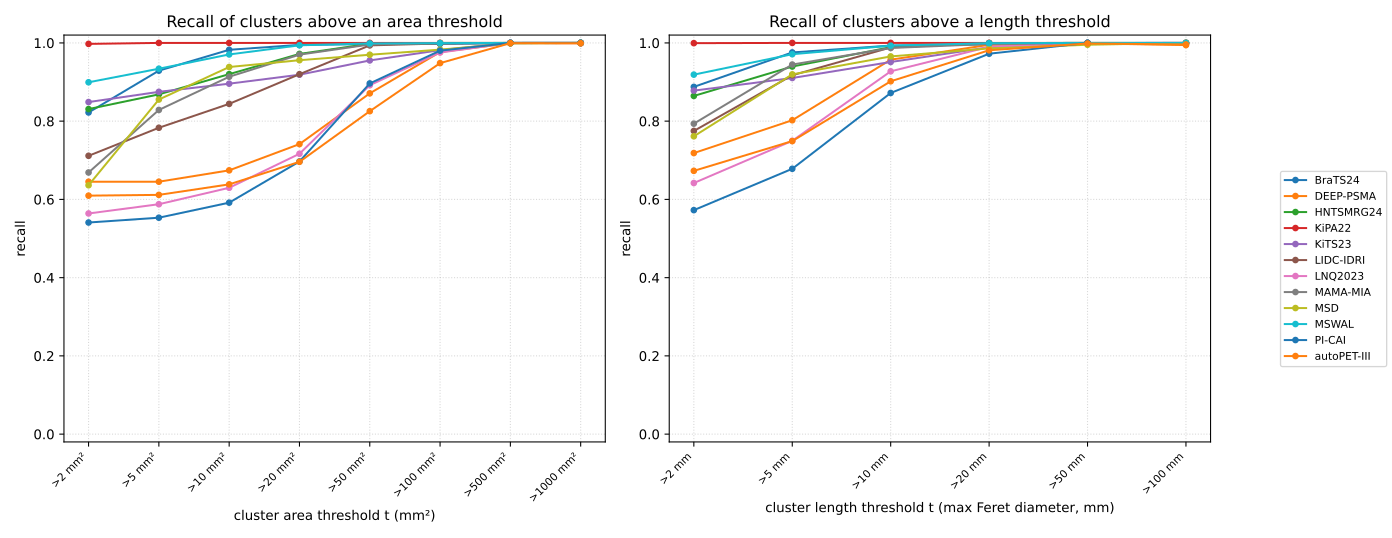
Recall above threshold, against cluster area (left) and cluster length (right), one curve per collection. Each point pools every cluster larger than the threshold, the quantity read from the third block of the tables. Both panels stratify the same 6,951,667 clusters. Recall rises with the floor in every collection and is at least 0.972 in every collection for clusters >20 mm long.
Implications for users
The images are unchanged; only the T/L measurements were rebuilt. They are larger in number, selected consistently across scans and viewing directions, and free of degenerate values. Every earlier annotation version (<1.4.0) remains published unchanged, so previous results stay reproducible.
One caveat applies to comparisons. Case counts per split are unchanged, but train/test membership changes for six collections (autoPET-III, BraTS24, HNTSMRG24, KiPA22, KiTS23, MSD), whose earlier splits had been force-aligned to v1.0.0. A v1.4.0 test metric should not be compared against a pre-1.4.0 one on those six.
The full release note documents every rule, number, and verification behind this post.