🌟 Highlights
- Research Gap: modern VLMs are not reliably able to produce precise quantitative measurements from medical images.
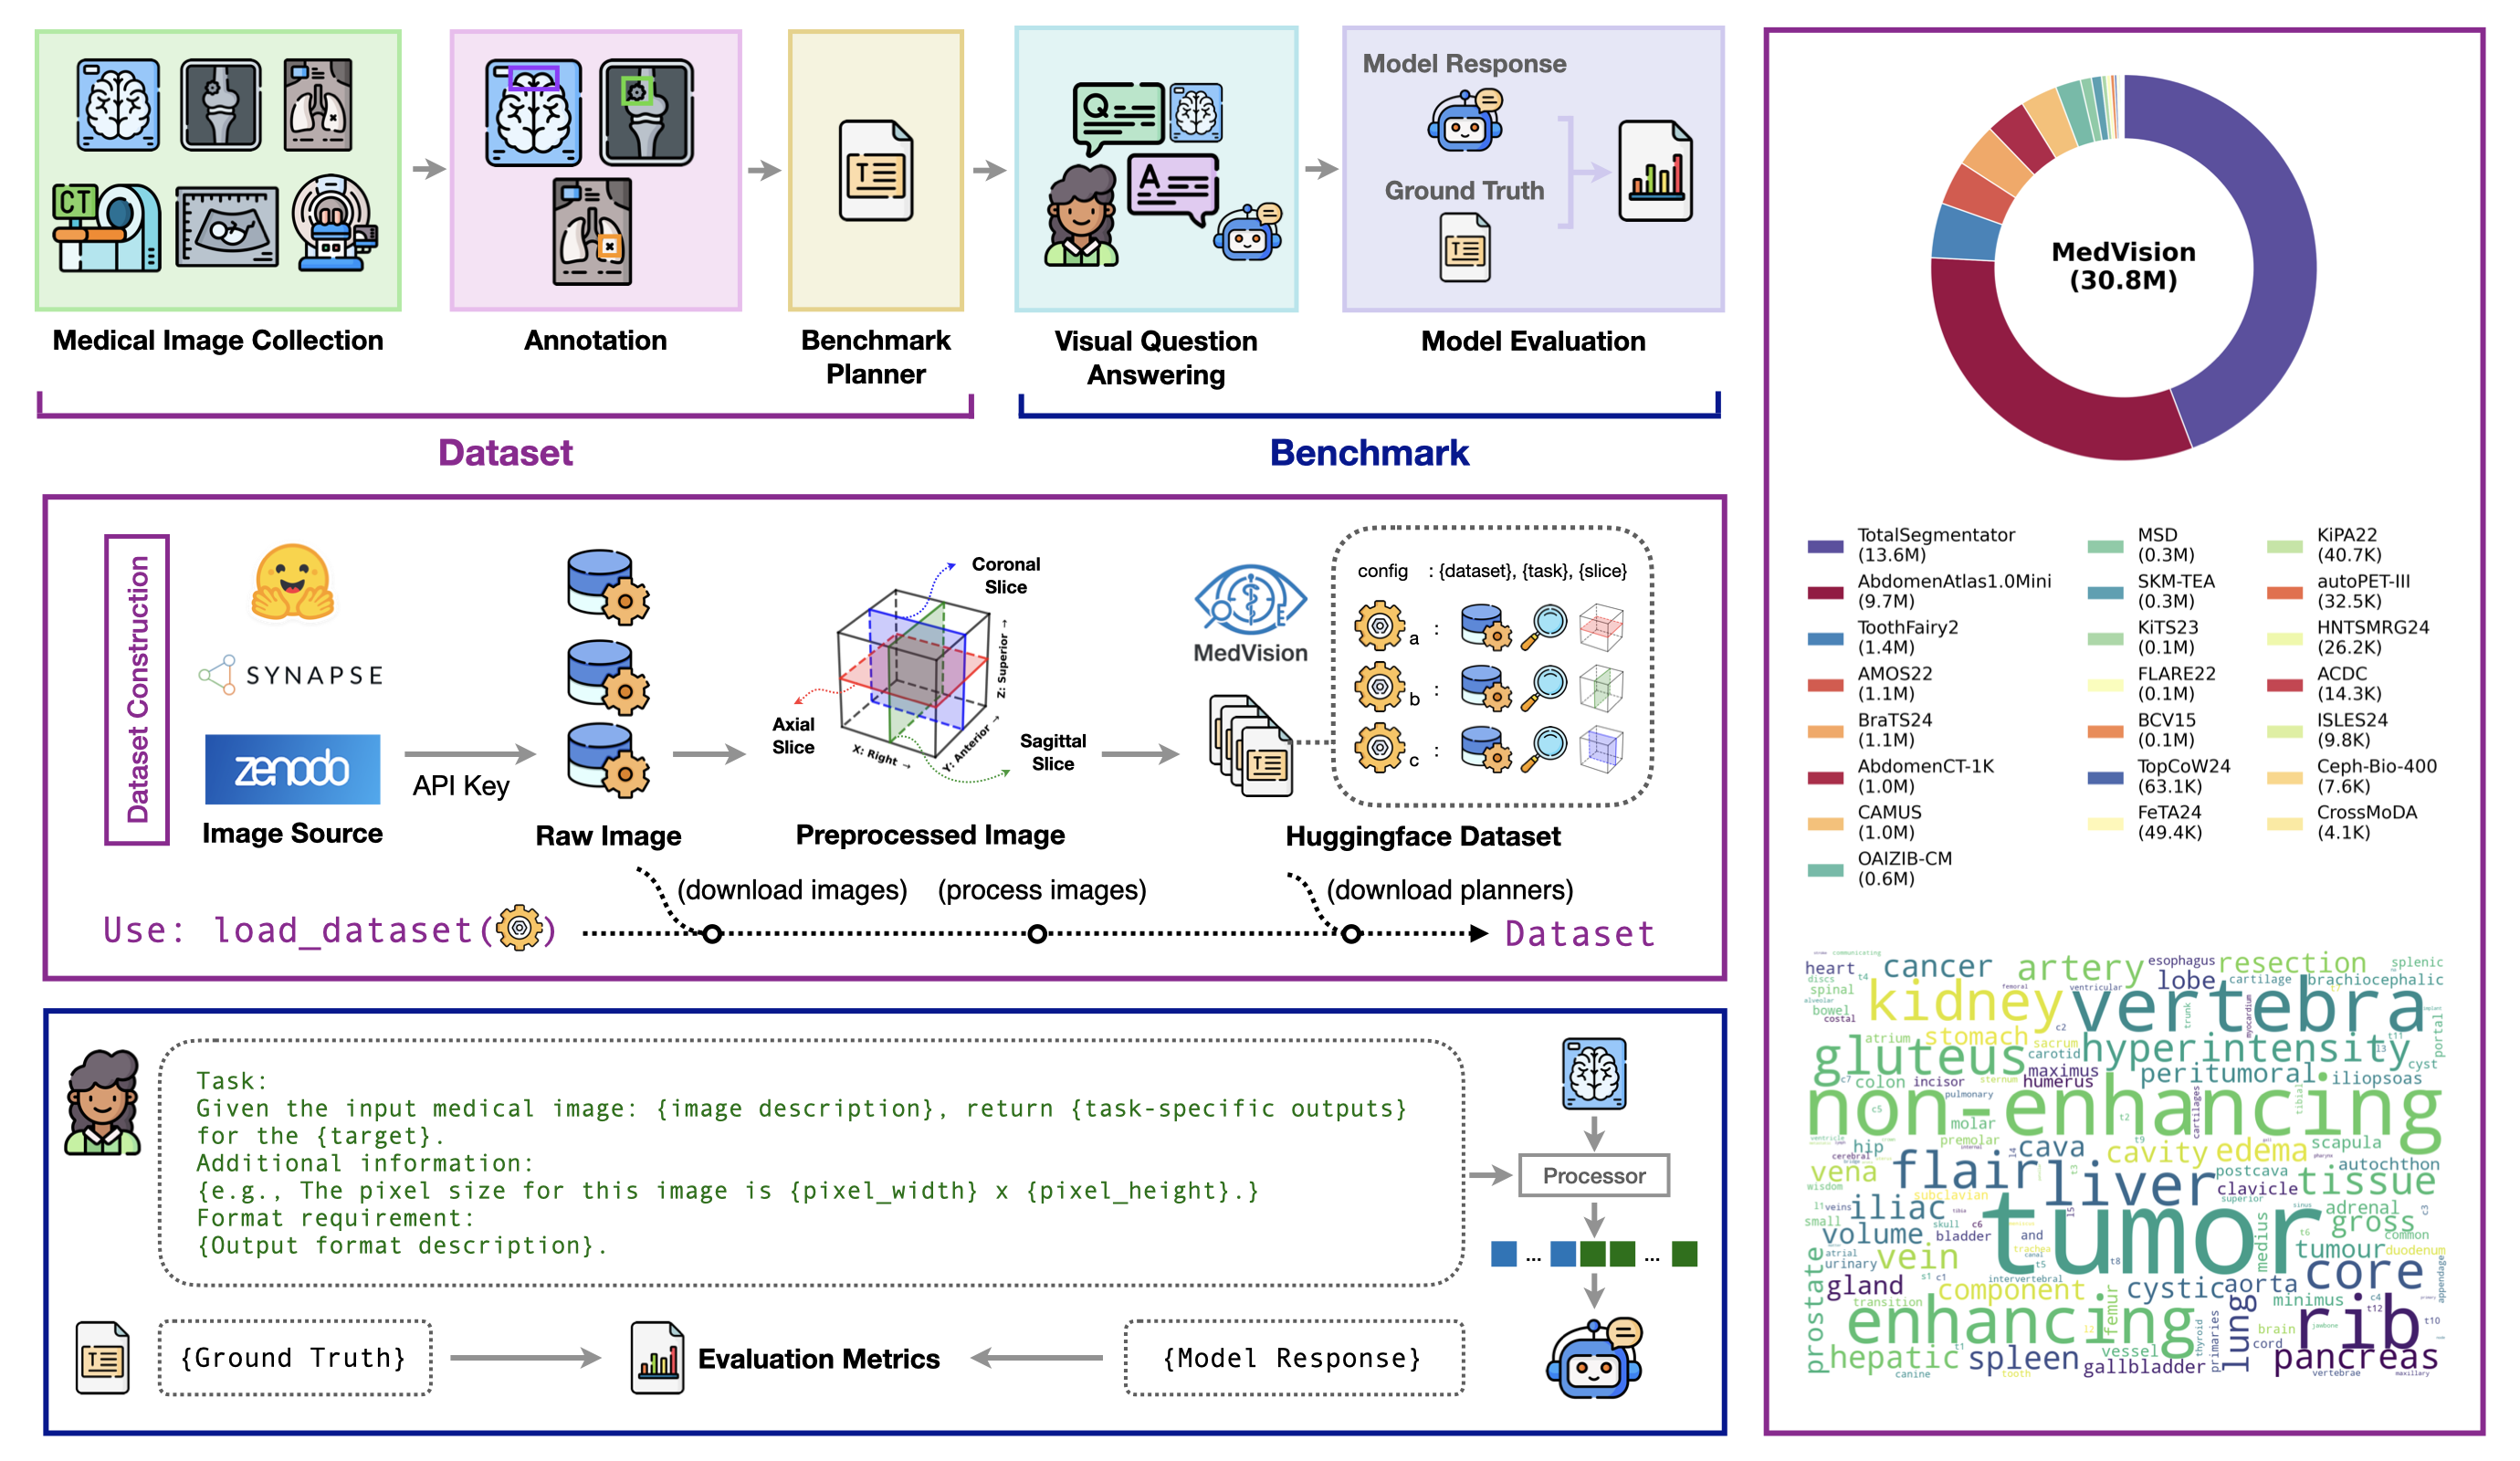
- Dataset: MedVision, a large-scale, multi-modality dataset for quantitative medical image analysis, covering 22 public datasets and 30.8M images with structured measurement annotations.
- Benchmark: the first comprehensive evaluation of contemporary VLMs on detection, tumor/lesion size estimation, and angle/distance measurement.
- Supervised Finetuning (SFT): SFT can improve the performance of VLMs on quantitative medical image analysis tasks.
- Code and Models: data, model checkpoints, and code (training and evaluation) are available
📀 Dataset
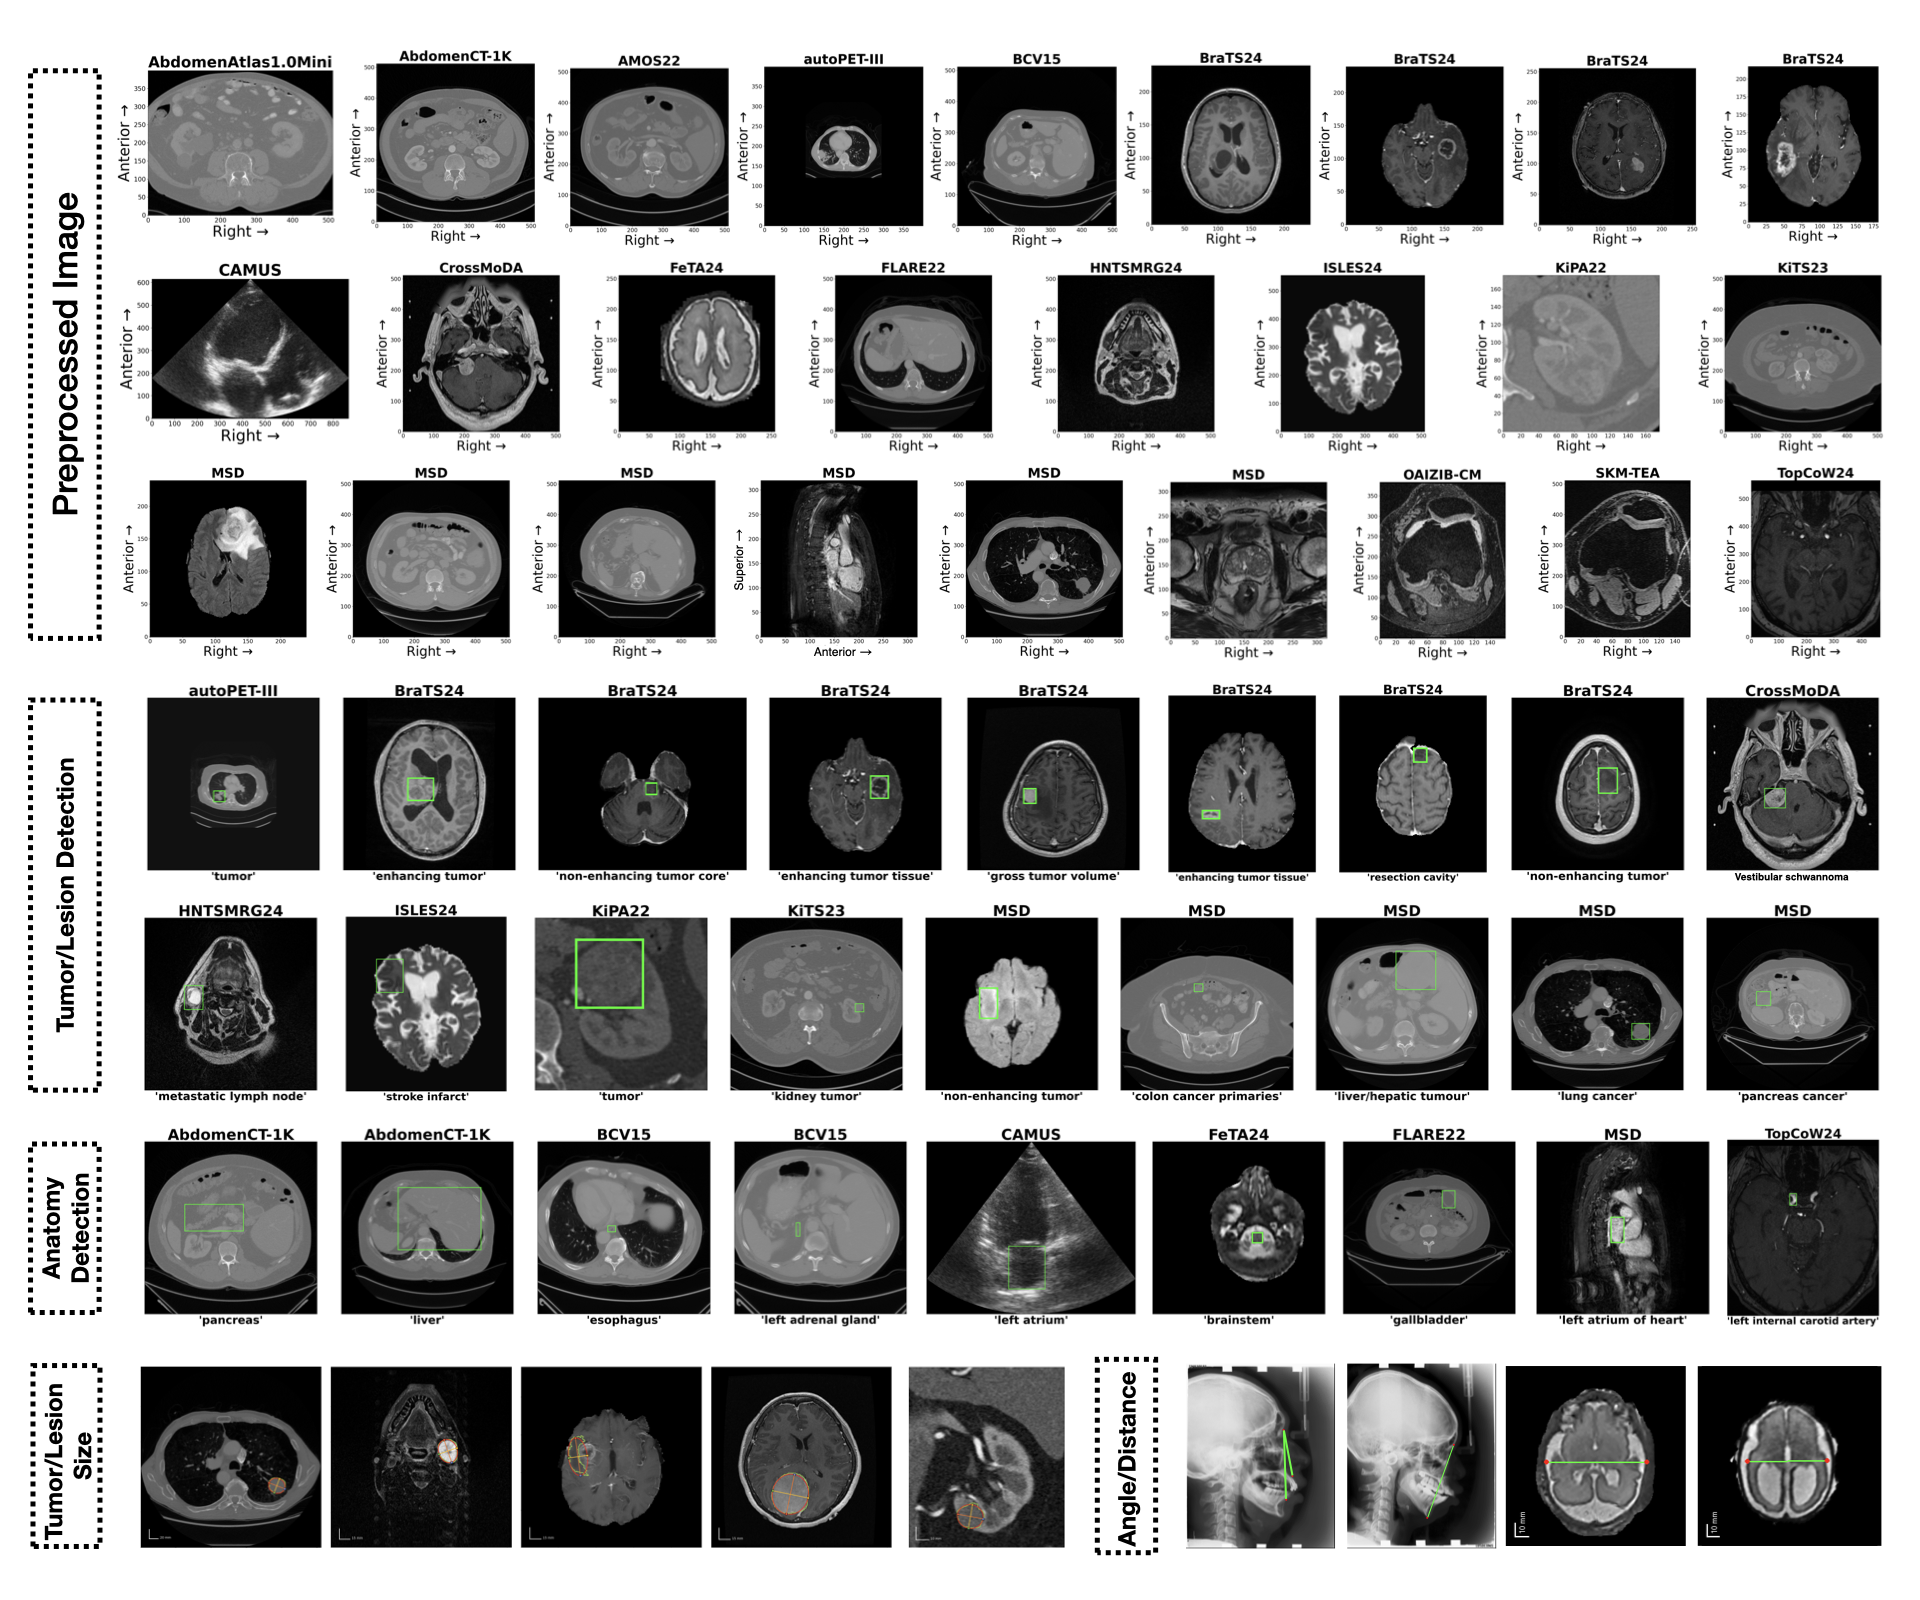
MedVision includes 22 public datasets and 30.8M image-annotation pairs. The dataset is available at here. Details are as follows:
Table 1: The MedVision dataset consists of public medical images and quantitative annotations from this study. MRI: Magnetic Resonance Imaging; CT: Computed Tomography; PET: positron emission tomography; US: Ultrasound; b-box: bounding box; T/L: tumor/lesion size; A/D: angle/distance; HF: HuggingFace; GC: Grand-Challenge; † redistributed.
| Dataset | Anatomy | Modality | Annotation | Availability | Source | # Sample (Train / Test) | ||
|---|---|---|---|---|---|---|---|---|
| b-box | T/L | A/D | ||||||
| AbdomenAtlas | abdomen | CT | b-box | open | HF | 6.8 / 2.9M | 0 | 0 |
| AbdomenCT-1K | abdomen | CT | b-box | open | Zenodo | 0.7 / 0.3M | 0 | 0 |
| ACDC | heart | MRI | b-box | open | HF†, others | 9.5 / 4.8K | 0 | 0 |
| AMOS22 | abdomen | CT, MRI | b-box | open | Zenodo | 0.8 / 0.3M | 0 | 0 |
| autoPEI-III | whole body | CT, PET | b-box, T/L | open | HF†, others | 22 / 9.7K | 0.5 / 0.2K | 0 |
| BCV15 | abdomen | CT | b-box | open | HF†, Synapse | 71 / 30K | 0 | 0 |
| BraTS24 | brain | MRI | b-box, T/L | open | HF†, Synapse | 0.8 / 0.3M | 7.9 / 3.1K | 0 |
| CAMUS | heart | US | b-box | open | HF†, others | 0.7 / 0.3M | 0 | 0 |
| Ceph-Bio-400 | head and neck | X-ray | b-box, A/D | open | HF†, others | 0 | 0 | 5.3 / 2.3K |
| CrossModDA | brain | MRI | b-box | open | HF†, Zenodo | 3.0 / 1.0K | 0 | 0 |
| FeTA24 | fetal brain | MRI | b-box, A/D | registration | Synapse | 34 / 15K | 0 | 0.2 / 0.1K |
| FLARE22 | abdomen | CT | b-box | open | HF†, others | 72 / 33K | 0 | 0 |
| HNTSMRG24 | head and neck | MRI | b-box, T/L | open | Zenodo | 18 / 6.6K | 1.0 / 0.4K | 0 |
| ISLES24 | brain | MRI | b-box | open | HF†, GC | 7.3 / 2.5K | 0 | 0 |
| KiPA22 | kidney | CT | b-box, T/L | open | HF†, GC | 26 / 11K | 2.1 / 1.0K | 0 |
| KiTS23 | kidney | CT | b-box, T/L | open | HF†, GC | 80 / 35K | 5.9 / 2.6K | 0 |
| MSD | multiple | CT, MRI | b-box, T/L | open | others | 0.2 / 0.1M | 5.3 / 2.2K | 0 |
| OAIZIB-CM | knee | MRI | b-box | open | HF | 0.5 / 0.2M | 0 | 0 |
| SKM-TEA | knee | MRI | b-box | registration | others | 0.2 / 0.1M | 0 | 0 |
| ToothFairy2 | tooth | CT | b-box | registration | others | 1.0 / 0.4M | 0 | 0 |
| TopCoW24 | brain | CT, MRI | b-box | open | HF†, Zenodo | 43 / 20K | 0 | 0 |
| TotalSegmentator | multiple | CT, MRI | b-box | open | HF†, Zenodo | 9.6 / 4.0M | 0 | 0 |
| Total | 22 / 9.2M | 23 / 9.6K | 5.6 / 2.4K | |||||
Q: How to use the dataset?
- Quick start
- Prepare dataset for MedVision benchmarking and finetuning: here
1️⃣ Detection
Q: Can VLMs localize healthy anatomical structures and abnormalities from medical images?
- Pretrained VLMs show limited ability in medical image detection tasks.
- With SFT, VLMs achieve dramatic improvement in the detection of both healthy anatomical structures and tumors/lesions.
- Small object and tumors/lesions detection is still challenging.
- SFT improves models’ generalizability (details in paper)
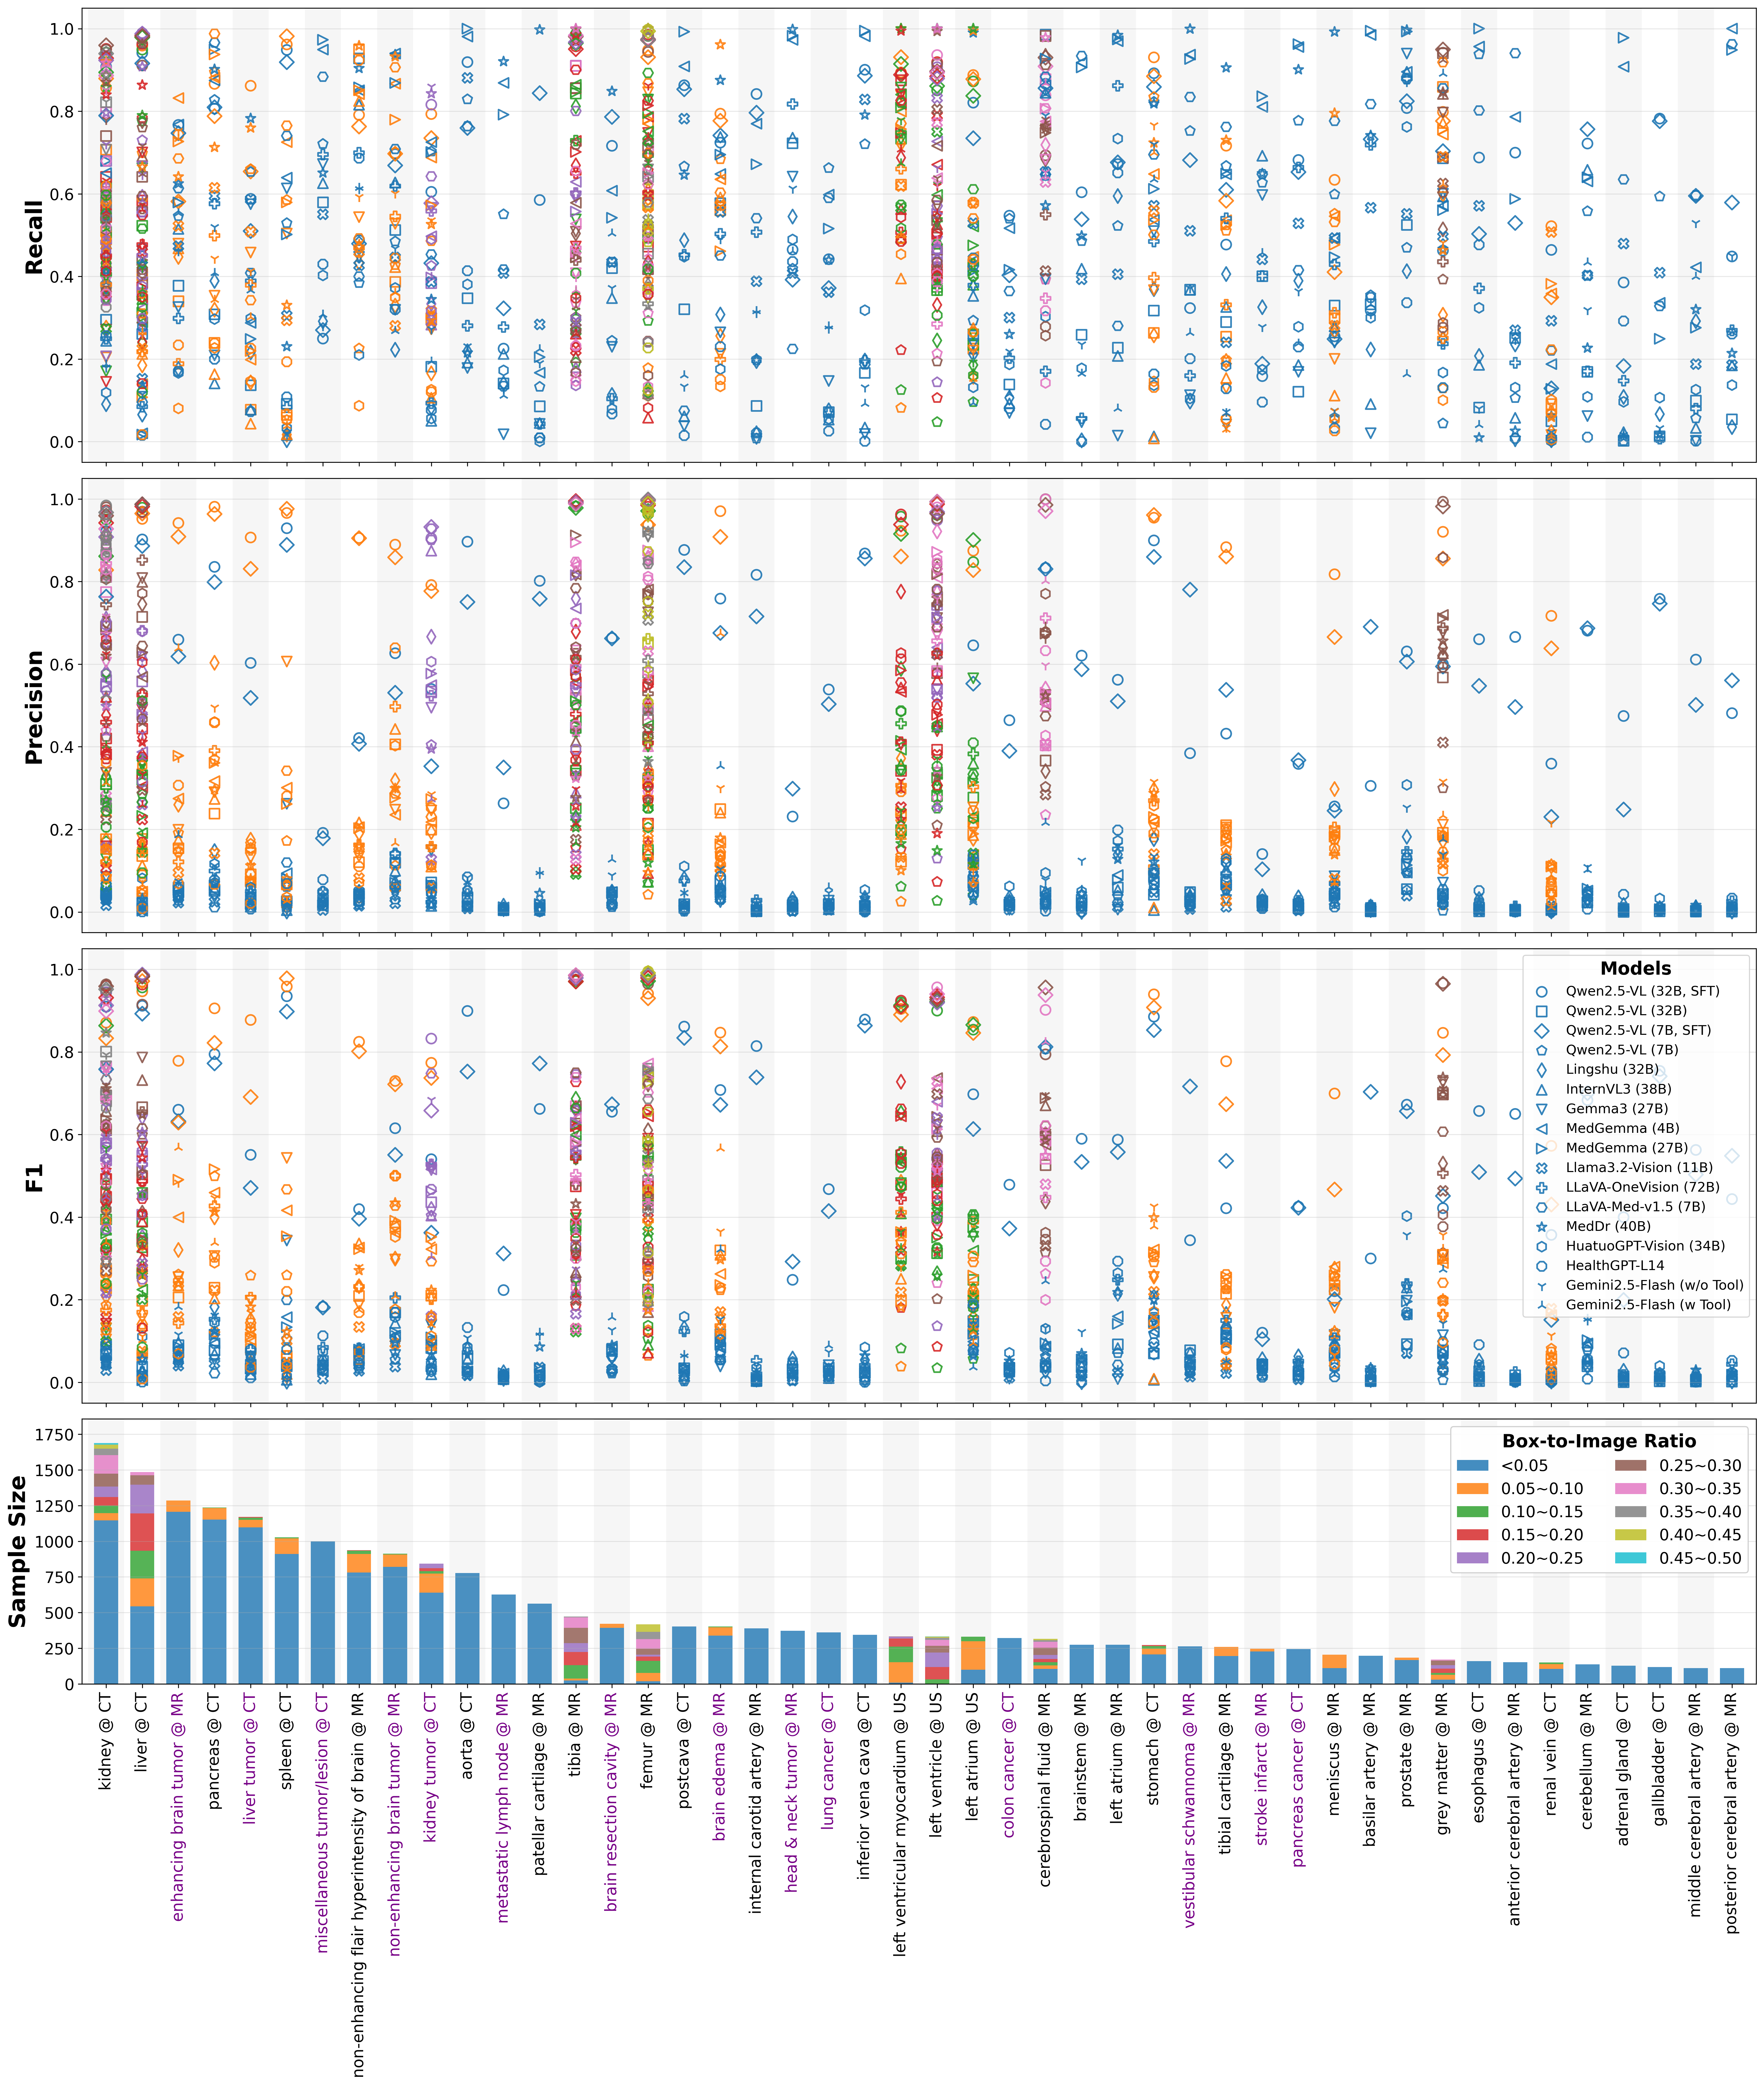
Group-level detection performance
Table 2: VLM performance on detection tasks. Targets are grouped into health anatomy and tumor/lesion detection tasks. Mean metrics weighted by sample sizes are reported in %. R: recall; P: precision; F1: F1 score; IoU: intersection over union; SR: success rate.
| Model | Anatomy | Tumor/Lesion | ||||||||||
|---|---|---|---|---|---|---|---|---|---|---|---|---|
| R ↑ | P ↑ | F1 ↑ | IoU ↑ | SR ↑ | IoU>0.5 ↑ | R ↑ | P ↑ | F1 ↑ | IoU ↑ | SR ↑ | IoU>0.5 ↑ | |
| Qwen2.5-VL (7B) | 50.4 | 9.5 | 12.4 | 7.6 | 100 | 1.4 | 54.5 | 3.4 | 5.6 | 3.1 | 100 | 0.0 |
| Qwen2.5-VL (32B) | 35.2 | 13.6 | 16.1 | 11.0 | 99.7 | 5.7 | 38.0 | 6.2 | 8.4 | 5.1 | 99.9 | 0.7 |
| Lingshu (32B) | 26.4 | 19.1 | 17.3 | 11.6 | 100 | 4.0 | 23.1 | 5.9 | 7.2 | 4.4 | 100 | 0.6 |
| InternVL3 (38B) | 24.5 | 14.5 | 14.5 | 9.8 | 100 | 5.3 | 39.2 | 5.9 | 7.6 | 4.5 | 100 | 0.4 |
| Gemma3 (27B) | 33.3 | 17.4 | 19.4 | 13.7 | 100 | 9.9 | 33.4 | 5.1 | 6.6 | 4.0 | 100 | 0.5 |
| MedGemma (4B) | 66.2 | 16.3 | 19.0 | 12.8 | 100 | 7.2 | 72.1 | 5.2 | 8.6 | 4.9 | 99.6 | 0.2 |
| MedGemma (27B) | 65.6 | 17.3 | 19.3 | 12.9 | 100 | 6.5 | 65.8 | 5.7 | 8.8 | 5.1 | 100 | 0.2 |
| Llama3.2-Vision (11B) | 47.0 | 8.1 | 10.4 | 6.8 | 73.8 | 2.7 | 45.6 | 2.1 | 3.6 | 2.0 | 70.1 | 0.0 |
| LLava-OneVision (72B) | 36.4 | 17.8 | 18.5 | 12.3 | 100 | 4.4 | 38.1 | 6.0 | 8.5 | 5.1 | 100 | 0.4 |
| LLaVA-Med-v1.5 (7B) | 60.7 | 15.7 | 18.6 | 12.6 | 99.1 | 7.0 | 50.6 | 4.7 | 7.3 | 4.3 | 89.0 | 0.8 |
| MedDr (40B) | 64.4 | 11.9 | 17.3 | 11.3 | 99.8 | 4.1 | 74.9 | 4.4 | 7.5 | 4.3 | 97.8 | 0.1 |
| HuatuoGPT-Vision (34B) | 25.3 | 20.5 | 16.3 | 10.7 | 100 | 3.6 | 20.8 | 5.9 | 7.0 | 4.3 | 100 | 0.6 |
| HealthGPT-L14 | 21.0 | 15.2 | 13.5 | 8.3 | 100 | 0.5 | 22.7 | 6.2 | 6.8 | 4.2 | 100 | 0.5 |
| Gemini2.5-Flash (w/o tool) | 35.4 | 16.1 | 18.7 | 12.8 | 99.5 | 6.8 | 41.4 | 7.1 | 10.1 | 6.3 | 98.3 | 1.2 |
| Gemini2.5-Flash (w tool) | 29.9 | 13.0 | 15.2 | 10.6 | 82.0 | 5.8 | 38.4 | 9.1 | 10.2 | 6.9 | 77.8 | 3.6 |
| Qwen2.5-VL (7B, SFT1M) | 80.6 | 79.1 | 78.2 | 71.6 | 100 | 79.5 | 55.8 | 51.6 | 49.4 | 41.2 | 100 | 46.2 |
| Qwen2.5-VL (32B, SFT1M) | 82.1 | 83.4 | 81.2 | 74.6 | 100 | 82.8 | 58.7 | 54.8 | 52.6 | 44.3 | 100 | 49.5 |
Label-level detection performance
This figure shows the detection metrics per label and box-to-image ratio (that indicates relative target size) for each models.
2️⃣ Tumor/Lesion Size Estimation
Q: Can VLMs estimate the size of tumors/lesions from medical images?
- Mean relative error (MRE) for SFT models are ∼ 30%, while it is 50~120% for off-the-shelf VLMs
- SFT improves models’ generalizability (details in paper)
VLMs are asked to estimate the longest diameter and its perpendicular diameter of tumors/lesions. An example of the quantitative annotations from this work is shown below.
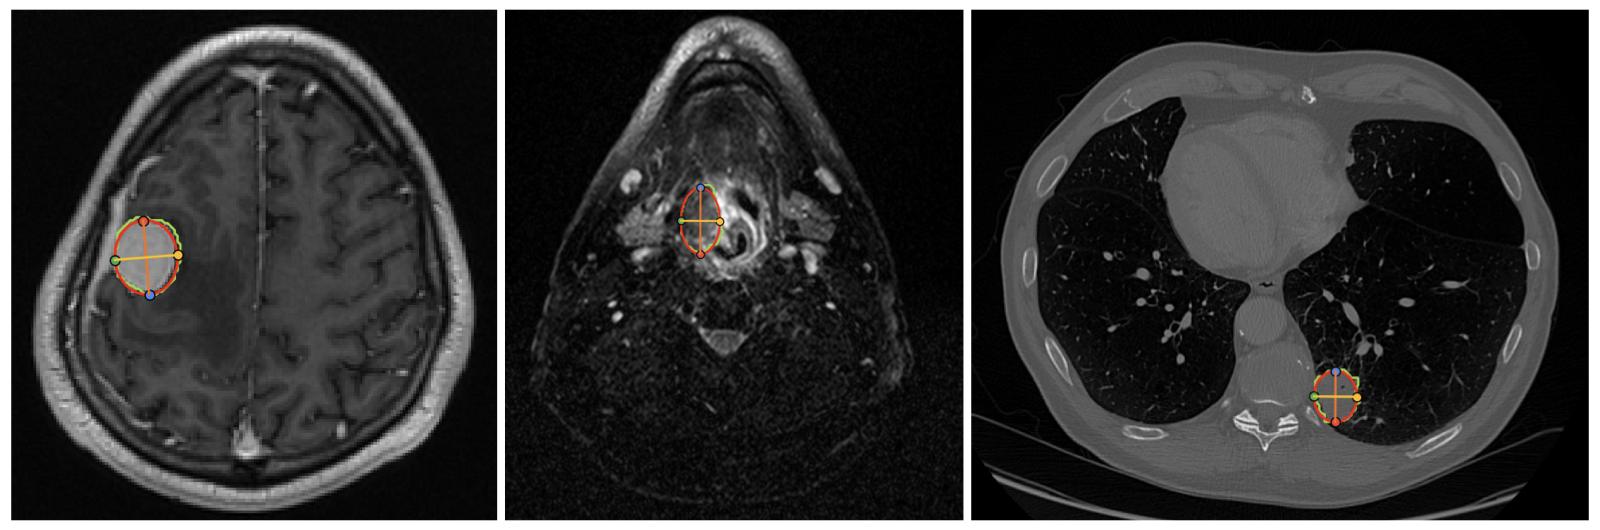
Figure 2: Tumor/lesion size annotation. An ellipse is fitted to the tumor/lesion mask and 4 landmarks are recorded.
Table 3: VLM performance on tumor/lesion size estimation tasks. Mean relative error (MRE), success rate (SR), and MRE<k are reported in %, while mean absolute error (MAE) is in millimeters.
| Model | MAE ↓ | MRE ↓ | SR ↑ | MRE<0.1 ↑ | MRE<0.2 ↑ | MRE<0.3 ↑ |
|---|---|---|---|---|---|---|
| Qwen2.5-VL (7B) | 32.3 | 71.5 | 100.0 | 0.3 | 1.7 | 3.2 |
| Qwen2.5-VL (32B) | 24.2 | 51.9 | 100.0 | 2.7 | 11.8 | 19.9 |
| Lingshu (32B) | 23.9 | 66.1 | 100.0 | 10.4 | 29.7 | 43.4 |
| InternVL3 (38B) | 22.6 | 50.1 | 100.0 | 4.5 | 15.0 | 24.2 |
| Gemma3 (27B) | 30.7 | 70.7 | 100.0 | 1.4 | 4.9 | 8.7 |
| MedGemma (4B) | 38.9 | 116.8 | 100.0 | 1.1 | 4.5 | 7.6 |
| MedGemma (27B) | 38.9 | 116.9 | 100.0 | 1.1 | 4.3 | 7.5 |
| Llama3.2-Vision (11B) | 25.7 | 61.9 | 99.1 | 4.6 | 14.0 | 21.1 |
| LLava-OneVision (72B) | 26.2 | 83.0 | 100.0 | 4.8 | 17.7 | 29.4 |
| LLaVA-Med-v1.5 (7B) | 48.8 | 74.7 | 22.6 | 0.3 | 0.6 | 1.1 |
| MedDr (40B) | 30.1 | 73.8 | 100.0 | 1.6 | 4.7 | 9.4 |
| HuatuoGPT-Vision (34B) | 28.9 | 89.1 | 100.0 | 8.5 | 26.2 | 42.3 |
| HealthGPT-L14 | 23.6 | 61.3 | 98.9 | 8.0 | 22.6 | 35.8 |
| Qwen2.5-VL (7B, SFT5K) | 13.2 | 30.6 | 100.0 | 20.8 | 41.5 | 62.1 |
| Qwen2.5-VL (32B, SFT5K) | 12.8 | 30.2 | 100.0 | 19.6 | 43.2 | 63.2 |
3️⃣ Angle/Distance Measurement
Q: Can VLMs measure angles or distances from medical image?
- Off-the-shelf VLMs fail to measure angles and distances accurately.
- SFT can significantly improve performance.
- Small-angle measurements remain challenging.
VLMs are prompted with task description and definition of angle or distance. Examples of landmarks in the Ceph-Bio-400 and FeTA24 datasets are shown below.
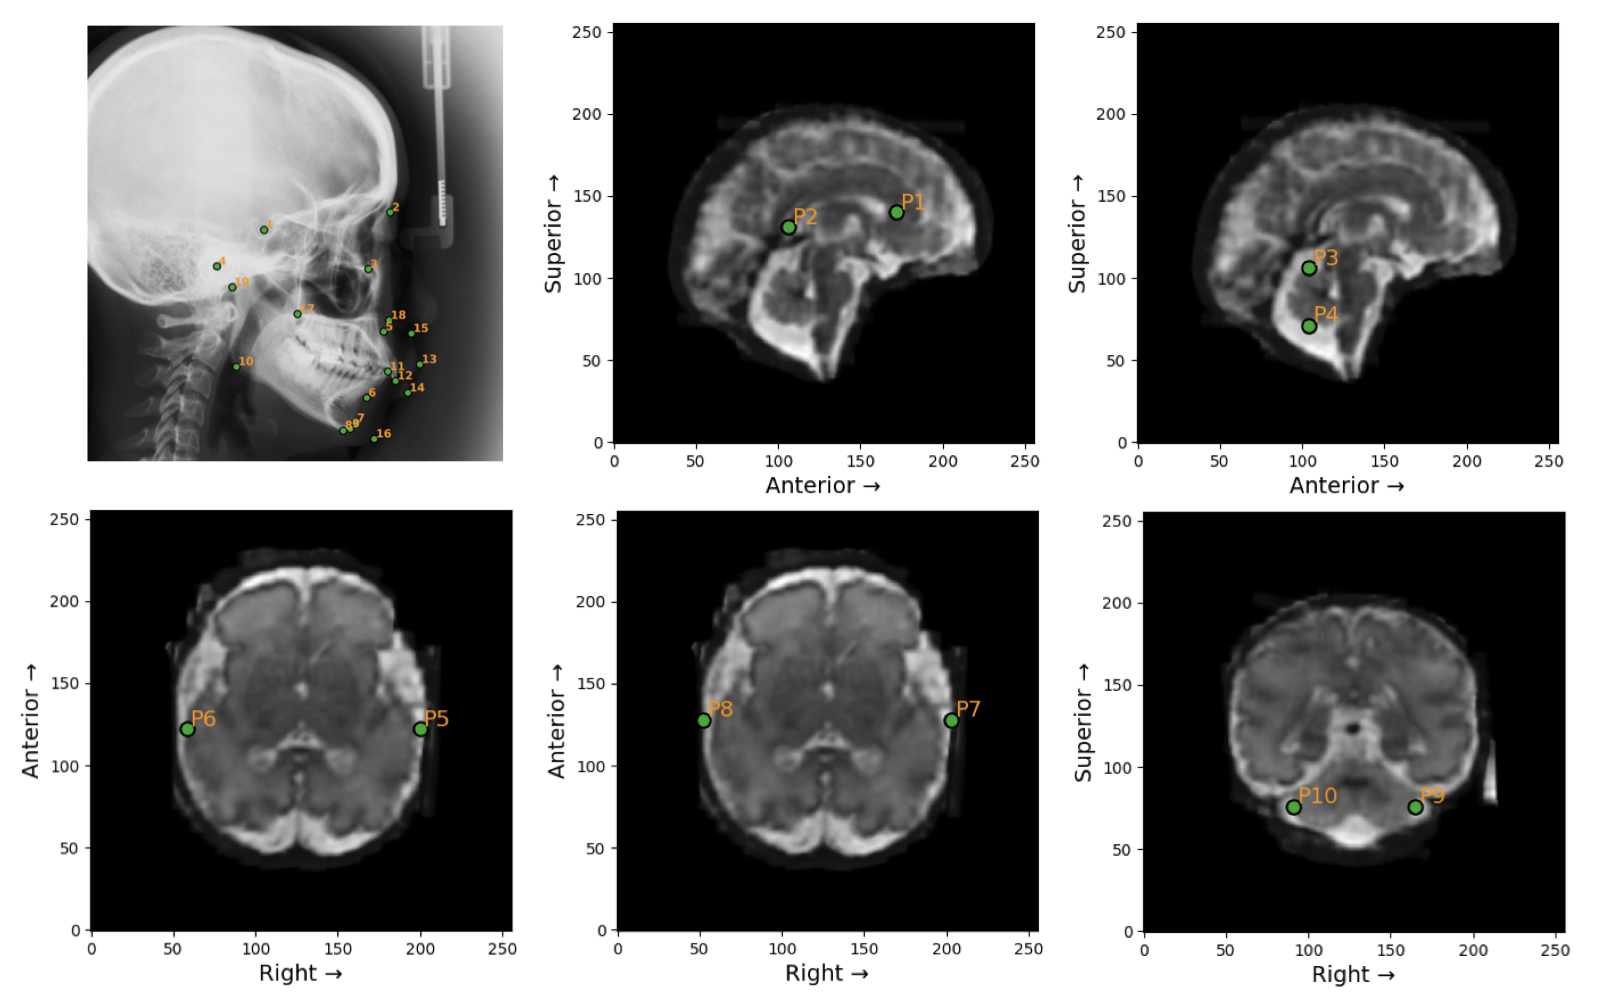
Figure 3: Landmarks in the Ceph-Bio-400 (top-left) and FeTA24 datasets. Ground truth angle and distance measurements are calculated from these landmarks.
Table 4: VLM performance on angle and distance measurement tasks. Mean relative errors (MRE), MRE<0.1, and success rate (SR) are reported in %. Mean absolute errors (MAE) are given in millimeters (distance) and degrees (angle).
| Model | Ceph-Bio-400 | FeTA24 | ||||||||||
|---|---|---|---|---|---|---|---|---|---|---|---|---|
| Distance | Angle | Distance | ||||||||||
| MAE ↓ | MRE ↓ | SR ↑ | MRE<0.1 ↑ | MAE ↓ | MRE ↓ | SR ↑ | MRE<0.1 ↑ | MAE ↓ | MRE ↓ | SR ↑ | MRE<0.1 ↑ | |
| Qwen2.5-VL (7B) | 56.3 | 80.1 | 100 | 0.9 | 55.1 | 3691 | 98.7 | 3.4 | 27.5 | 61.6 | 100 | 2.0 |
| Qwen2.5-VL (32B) | 59.7 | 86.0 | 100 | 0.2 | 41.0 | 3287 | 100 | 2.0 | 19.5 | 49.6 | 100 | 6.0 |
| Lingshu (32B) | 17.3 | 26.1 | 100 | 15.5 | 31.2 | 4648 | 100 | 10.4 | 38.5 | 120.9 | 100 | 0.0 |
| InternVL3 (38B) | 22.1 | 38.2 | 100 | 11.1 | 66.1 | 4405 | 100 | 4.3 | 19.7 | 54.7 | 100 | 11.0 |
| Gemma3 (27B) | 22.6 | 32.3 | 100 | 22.4 | 33.6 | 7862 | 100 | 13.8 | 18.1 | 40.2 | 100 | 15.0 |
| MedGemma (4B) | 43.4 | 67.9 | 100 | 6.5 | 30.5 | 2780 | 100 | 5.8 | 26.2 | 60.4 | 100 | 5.0 |
| MedGemma (27B) | 43.9 | 68.8 | 100 | 6.4 | 29.9 | 2168 | 100 | 6.4 | 26.2 | 60.4 | 100 | 5.0 |
| Llama3.2-Vision (11B) | 81.6 | 117.4 | 100 | 2.9 | 55.3 | 9318.6 | 100 | 8.0 | 29.9 | 73.4 | 100 | 2.0 |
| LLava-OneVision (72B) | 36.3 | 67.8 | 100 | 18.8 | 62.6 | 12269.1 | 100 | 0.0 | 46.0 | 130.7 | 100 | 4.0 |
| MedDr (40B) | 33.7 | 53.6 | 100 | 6.0 | 54.8 | 9149.2 | 100 | 0.2 | 37.1 | 78.5 | 100 | 5.0 |
| HuatuoGPT-Vision (34B) | 45.8 | 65.2 | 100 | 2.8 | 65.8 | 5741.1 | 100 | 9.0 | 40.5 | 83.3 | 100 | 15.0 |
| HealthGPT-L14 | 66.8 | 97.5 | 100 | 1.1 | 42.9 | 434.6 | 100 | 0.0 | 32.1 | 79.4 | 100 | 5.0 |
| Qwen2.5-VL (7B, SFT5K) | 3.5 | 5.4 | 100 | 86.4 | 3.6 | 126.8 | 100 | 50.1 | 4.1 | 13.1 | 100 | 49.0 |
| Qwen2.5-VL (32B, SFT5K) | 4.5 | 7.9 | 100 | 83.5 | 4.0 | 540.2 | 100 | 50.5 | 4.1 | 14.0 | 100 | 54.0 |